如何制作一个3D时空轨迹图?

4
假设我有三个数据框,记录对象的纬度、经度和时间戳信息,每一列代表一个不同的对象,每一行代表一个时间点。
latitudes =
object          1            2            3                
0          -8.064267    -8.047483    -8.056339       
1          -8.064267    -8.047483    -8.056339     
2          -8.064267    -8.047483    -8.056339   
3          -8.064267    -8.047483    -8.056339   
4          -8.064267    -8.047483    -8.056339   
5          -8.064267    -8.047483    -8.056339   


longitudes =
object          1            2            3         
0         -34.878386   -34.904086   -34.889661     
1         -34.878386   -34.904086   -34.889661     
2         -34.878386   -34.904086   -34.889661    
3         -34.878386   -34.904086   -34.889661   
4         -34.878386   -34.904086   -34.889661    
5         -34.878386   -34.904086   -34.889661   

times =
object  1                      2                     3                   
0       2016-03-05 07:52:00   2016-03-05 16:26:00   2016-03-05 16:58:00   
1       2016-03-05 08:19:00   2016-03-05 16:42:00   2016-03-05 17:45:00   
2       2016-03-05 08:52:00   2016-03-05 17:06:00   2016-03-05 17:58:00   
3       2016-03-05 09:36:00   2016-03-05 18:21:00   2016-03-05 18:23:00   
4           NaT               2016-03-05 23:06:00   2016-03-05 22:38:00   
5           NaT               2016-03-05 23:09:00       NaT  

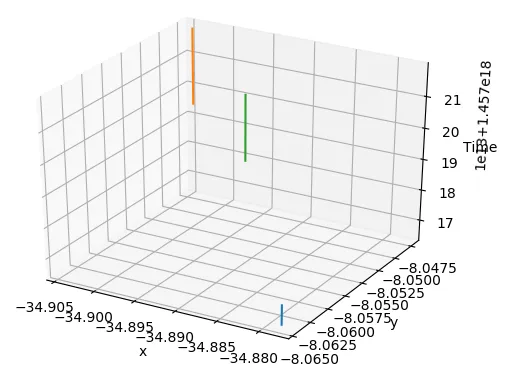
我希望绘制一个三维轨迹图,其中时间为z轴,经度为x轴,纬度为y轴,所有物体的轨迹都在同一张图上。我该如何做?
这是我的尝试,但它不起作用:
    from mpl_toolkits.mplot3d import Axes3D
    import matplotlib.pyplot as plt
    fig = plt.figure()
    ax = fig.add_subplot(111,projection='3d')
ax.plot(longitudes.values,latitudes.values,times.values)
    ax.set_xlabel('x')
    ax.set_ylabel('y')
    ax.set_zlabel('Time')
    plt.show()

错误:

ValueError: third arg must be a format string

谢谢你


1
对于二维图,第三个参数用于标记类型,并使用字符串指定。我认为您收到默认错误消息是因为未能理解 times.values 数组。这个数组的类型是什么?它看起来像日期时间或其他类型。在调用 plot 之前,您是否尝试将其转换为浮点数? - user2660966
其实它是一个对象,因为除了日期时间值之外还有一些 NaT。 - Helk
我建议您提供一个 [mcve],以便可以复制和运行以重现错误。否则,解决方案将需要做出假设,这些假设可能在您的情况下有效或无效。 - ImportanceOfBeingErnest
@ImportanceOfBeingErnest 我编辑了问题并向“times”数据框中添加了“NaT”值,因此它应该是MCV。 - Helk
不,这不是一个 [mcve],我花了很长时间才能重现这个问题。请看我的回答,了解一下 [mcve] 是什么样子的 - 它可以被复制并运行。 - ImportanceOfBeingErnest
2个回答

4
fig = plt.figure()
ax = fig.gca(projection='3d')
ax.set_xlabel('x')
ax.set_ylabel('y')
ax.set_zlabel('Time')

for t in times.columns:
    ax.plot(longitudes[t].values, latitudes[t].values, times[t].values, label='t')

ax.legend()

[1]: https://i.stack.imgur.com/QnQLm.png


1
谢谢你的回答。我仍然得到相同的错误。我的时间数据框架是datetime类型的。你是如何转换它的? - Helk
我在一些时间值中也有'NaT',因为对象不一定具有相同数量的时间点,这可能是错误的原因。我不知道。 - Helk

1
你需要过滤掉NaT值,因为它们无法绘制。
latitudes = u"""                
-8.064267    -8.047483    -8.056339       
-8.064267    -8.047483    -8.056339     
-8.064267    -8.047483    -8.056339   
-8.064267    -8.047483    -8.056339   
-8.064267    -8.047483    -8.056339   
-8.064267    -8.047483    -8.056339"""  


longitudes = u"""        
-34.878386   -34.904086   -34.889661     
-34.878386   -34.904086   -34.889661     
-34.878386   -34.904086   -34.889661    
-34.878386   -34.904086   -34.889661   
-34.878386   -34.904086   -34.889661    
-34.878386   -34.904086   -34.889661""" 

times = u"""                
2016-03-05 07:52:00, 2016-03-05 16:26:00, 2016-03-05 16:58:00   
2016-03-05 08:19:00, 2016-03-05 16:42:00, 2016-03-05 17:45:00   
2016-03-05 08:52:00, 2016-03-05 17:06:00, 2016-03-05 17:58:00   
2016-03-05 09:36:00, 2016-03-05 18:21:00, 2016-03-05 18:23:00   
2016-03-05 09:36:00, 2016-03-05 23:06:00, 2016-03-05 22:38:00   
2016-03-05 09:36:00, 2016-03-05 23:09:00, 2016-03-05 09:36:00
"""

import io
import pandas as pd
import matplotlib.pyplot as plt
from mpl_toolkits.mplot3d import Axes3D

kw = dict(delim_whitespace=True, header=None)
latitudes = pd.read_csv(io.StringIO(latitudes),**kw)
longitudes = pd.read_csv(io.StringIO(longitudes),**kw)
times = pd.read_csv(io.StringIO(times), delimiter=",",
                    infer_datetime_format=True,header=None)
times.iloc[4:,0] = None
times.iloc[5,2] = None

for i in times.columns:
    times[i] = pd.to_datetime(times[i], format="%Y-%m-%d %H:%M:%S")

fig = plt.figure()
ax = fig.add_subplot(111,projection='3d')

for t in times.columns:
    inx = times[t].values != None
    x = longitudes[t].values[inx]
    y = latitudes[t].values[inx]
    z = times[t].values[inx]
    ax.plot(x,y,z)

ax.set_xlabel('x')
ax.set_ylabel('y')
ax.set_zlabel('Time')
plt.show()

enter image description here


我尝试了你的方法。这行代码仍然无法过滤NaT值:inx = times[t].values != None - Helk
好的,我只能告诉你,正如上面的答案所示,它确实可以工作。您可以决定最终提供一个[mcve]来重现该问题的错误。 - ImportanceOfBeingErnest

网页内容由stack overflow 提供, 点击上面的
可以查看英文原文,
原文链接