我希望生成变量(列)之间存在相关性的图表,包括相关性大于和小于某一点且p值小于0.01的变量。这些图表将是使用ggplot2绘制的线形或条形图,绘制两个相关的列(变量)。
目前我的方法概述如下,附有虚拟数据,我希望得到下一步的指引。
# Create some dummy data
df <- data.frame(sample(1:50), sample(1:50), sample(1:50), sample(1:50))
colnames(df) <- c("var1", "var2", "var3", "var4")
# Find correlations in the dummy data
df.cor <- cor(df)
# Make up some random pvalues for this example
x <- 0:1000
df.cor.pvals <- data.frame(sample(x/1000, 4), sample(x/1000, 4), sample(x/1000, 4), sample(x/1000,4))
colnames(df.cor.pvals) <- c("var1", "var2", "var3", "var4")
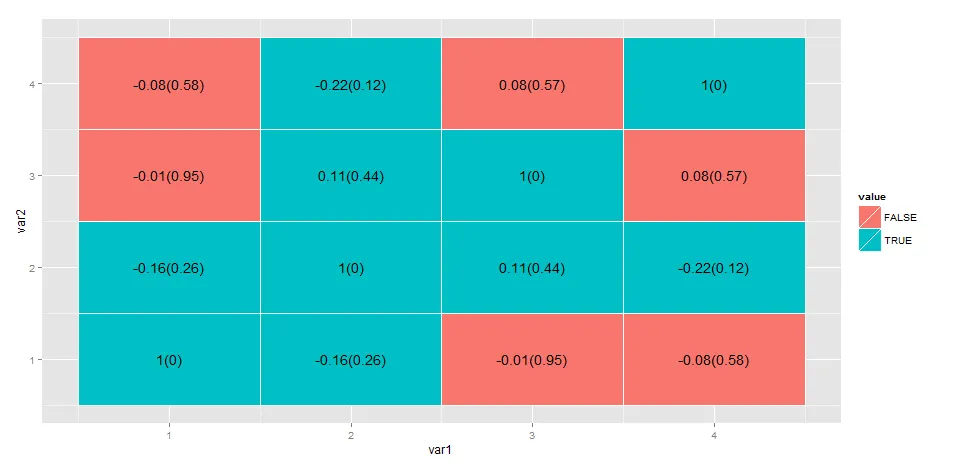
# Find the significant correlations
df.cor.extreme <- ((df.cor < -0.01 | df.cor > 0.01) & df.cor.pvals < 0.5)
# Ready data to for plotting
df$rownames <- rownames(df)
df.melt <- melt(df, id="rownames")
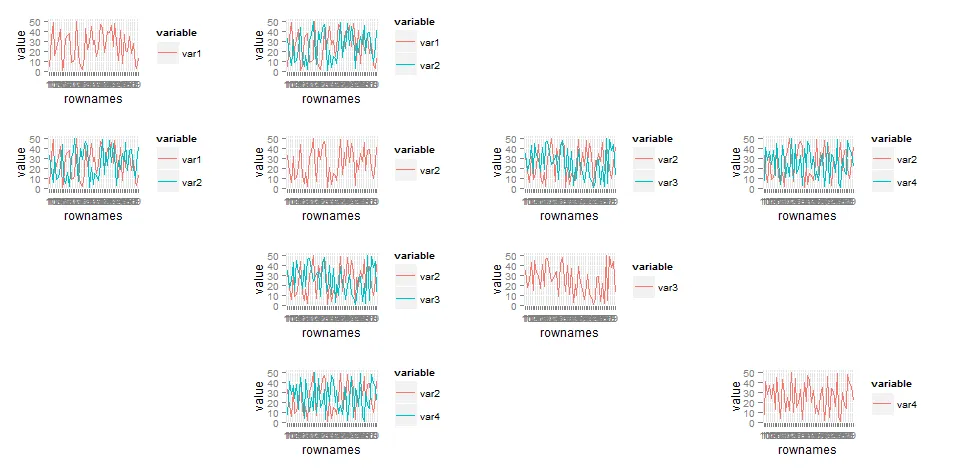
# I want to plot the combinations of variables that have a TRUE value
# in the df.cor.extreme matrix
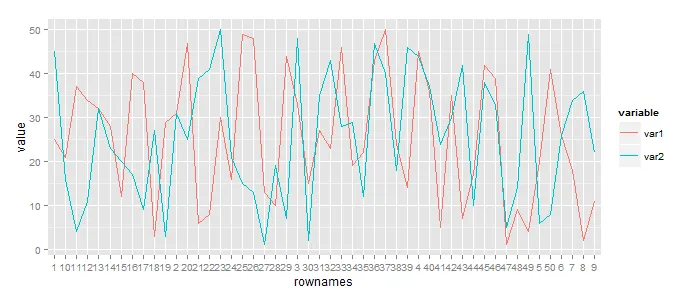
如果var1和var2的值为TRUE,则下面是硬编码示例。我认为这就是需要某种循环来生成多个情节,其中varA和varB相关的地方。
ggplot(df.melt[(df.melt$variable=="var1" | df.melt$variable=="var2"),], aes(x=rownames, y=value, group=variable, colour=variable)) +
  geom_line()
df.cor.pvals为什么有50行 - 它不应该与df.cor相同吗? - Drew Steendf.cor.extreme <- df.cor < -0.01 | df.cor > 0.01来获取你所需的相关矩阵。 - Drew Steen