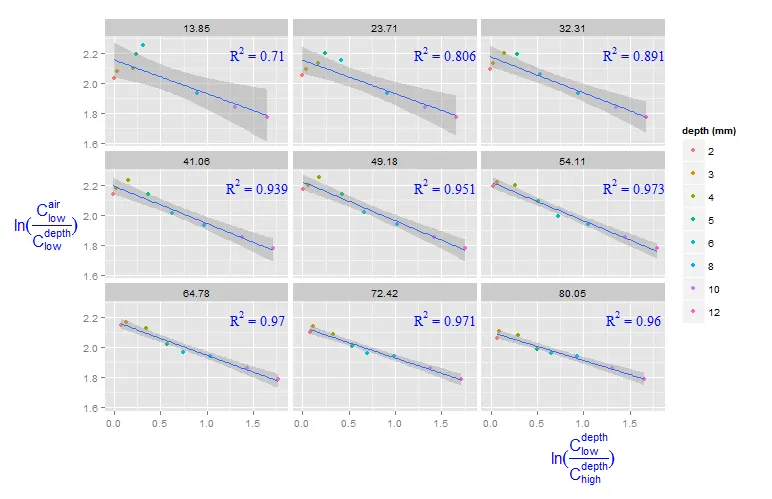
我正在对多个分面绘制geom_points,并希望在每个分面上注释R ^ 2(最好是在facet_label而不是图形上)。我找到了一些代码here,它将为整个数据框提供R ^ 2和回归方程,而不是子集。
我的数据框已附加。
基本上,我想将ln_x和ln_y(由于名称约定不佳,ln_x实际上在y轴上)与roi_size相关联。 这是我目前的情况:
lm_eqn = function(df){
    m = lm(ln_x ~ ln_y, df);
    eq <- substitute(~~R^2~"="~r2,
                     list(r2 = format(summary(m)$r.squared, digits = 3)))
    as.character(as.expression(eq));
}
p2 <- ggplot(df, aes(x=ln_x, y=ln_y)) + geom_point(shape=19, aes(colour=factor(depth))) + geom_smooth(method="lm") +
    facet_wrap(~roi_size) + scale_color_discrete("depth (mm)")

p2  + labs(y=expression(ln(frac(C[low]^air,C[low]^depth))),
           x=expression(ln(frac(C[low]^depth,C[high]^depth))) ) +
    theme(axis.title.x = element_text(colour='blue', size=16, hjust=0.9)) +
    theme(axis.title.y = element_text(colour='blue', size=16, angle=0)) +
    geom_text(aes(x=1.5,y=2.2,label=lm_eqn(df),family="serif"),
       color='blue',  parse=TRUE)
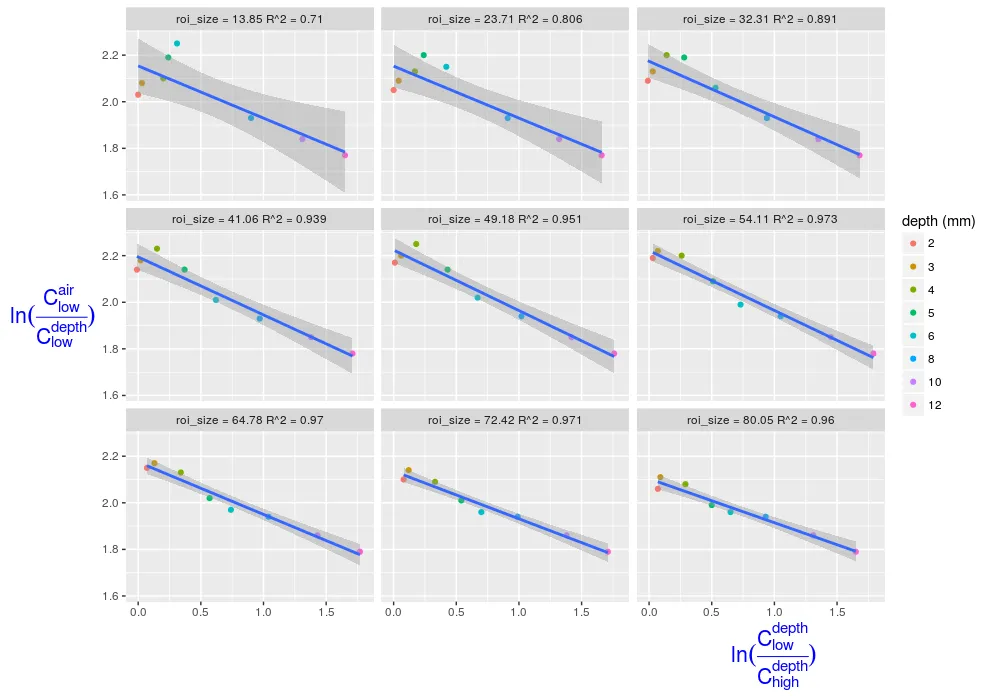
这将在每个小区域上打印完整数据帧的R ^ 2。我如何调整,以便根据小区域变量(roi_size),打印每个小区域中的数据的R ^ 2。另外,我如何在小区域标签中打印文本,而不是在图形上打印。
structure(list(roi_size = c(54.11, 49.18, 41.06, 32.31, 23.71,
13.85, 64.78, 72.42, 80.05, 54.11, 49.18, 41.06, 32.31, 23.71,
13.85, 64.78, 72.42, 80.05, 54.11, 49.18, 41.06, 32.31, 23.71,
13.85, 64.78, 72.42, 80.05, 54.11, 49.18, 41.06, 32.31, 23.71,
13.85, 64.78, 72.42, 80.05, 54.11, 49.18, 41.06, 32.31, 23.71,
13.85, 64.78, 72.42, 80.05, 54.11, 49.18, 41.06, 32.31, 23.71,
13.85, 64.78, 72.42, 80.05, 54.11, 49.18, 41.06, 32.31, 23.71,
13.85, 64.78, 72.42, 80.05, 54.11, 49.18, 41.06, 32.31, 23.71,
13.85, 64.78, 72.42, 80.05), depth = c(6L, 6L, 6L, 6L, 6L, 6L,
6L, 6L, 6L, 3L, 3L, 3L, 3L, 3L, 3L, 3L, 3L, 3L, 12L, 12L, 12L,
12L, 12L, 12L, 12L, 12L, 12L, 2L, 2L, 2L, 2L, 2L, 2L, 2L, 2L,
2L, 8L, 8L, 8L, 8L, 8L, 8L, 8L, 8L, 8L, 4L, 4L, 4L, 4L, 4L, 4L,
4L, 4L, 4L, 10L, 10L, 10L, 10L, 10L, 10L, 10L, 10L, 10L, 5L,
5L, 5L, 5L, 5L, 5L, 5L, 5L, 5L), Cl_0 = c(2717019L, 2290435L,
1705411L, 1255867L, 676405L, 375830L, 3384555L, 3522927L, 3636684L,
2717019L, 2290435L, 1705411L, 1255867L, 676405L, 375830L, 3384555L,
3522927L, 3636684L, 2717019L, 2290435L, 1705411L, 1255867L, 676405L,
375830L, 3384555L, 3522927L, 3636684L, 2717019L, 2290435L, 1705411L,
1255867L, 676405L, 375830L, 3384555L, 3522927L, 3636684L, 2717019L,
2290435L, 1705411L, 1255867L, 676405L, 375830L, 3384555L, 3522927L,
3636684L, 2717019L, 2290435L, 1705411L, 1255867L, 676405L, 375830L,
3384555L, 3522927L, 3636684L, 2717019L, 2290435L, 1705411L, 1255867L,
676405L, 375830L, 3384555L, 3522927L, 3636684L, 2717019L, 2290435L,
1705411L, 1255867L, 676405L, 375830L, 3384555L, 3522927L, 3636684L
), Cl_d = c(1311893L, 1176363L, 914919L, 737442L, 443761L, 276579L,
1613011L, 1747390L, 1899656L, 2530911L, 2163881L, 1677116L, 1216875L,
653126L, 363175L, 2985875L, 3138564L, 3324939L, 455288L, 393637L,
307026L, 233272L, 128367L, 71947L, 577623L, 634500L, 699825L,
2635610L, 2271192L, 1728341L, 1263713L, 675911L, 374713L, 3167048L,
3262837L, 3405654L, 947980L, 822282L, 643571L, 491770L, 271630L,
152706L, 1193026L, 1306287L, 1430309L, 2086247L, 1908468L, 1466086L,
1090016L, 568628L, 308709L, 2416470L, 2544936L, 2732394L, 637259L,
551223L, 430289L, 326529L, 179923L, 100903L, 808082L, 887548L,
977026L, 1629081L, 1490948L, 1176605L, 948455L, 530729L, 296142L,
1911408L, 2045920L, 2205722L), Ch_d = c(179729L, 156181L, 122603L,
93752L, 51903L, 29190L, 225278L, 245940L, 268489L, 274540L, 239477L,
188807L, 145219L, 80749L, 45514L, 341415L, 371116L, 402963L,
76663L, 66425L, 51975L, 39622L, 21903L, 12308L, 96886L, 106240L,
116792L, 296116L, 258520L, 203978L, 156945L, 87444L, 49387L,
367877L, 399837L, 433996L, 136638L, 118579L, 92957L, 71027L,
39303L, 22096L, 171813L, 187973L, 205771L, 230744L, 200925L,
158061L, 121140L, 67251L, 37884L, 288238L, 314112L, 342237L,
100033L, 86700L, 67814L, 51612L, 28495L, 16011L, 126312L, 138429L,
151981L, 201914L, 175714L, 138119L, 105720L, 58636L, 32989L,
252634L, 275480L, 300587L), ln_x = c(0.73, 0.67, 0.62, 0.53,
0.42, 0.31, 0.74, 0.7, 0.65, 0.07, 0.06, 0.02, 0.03, 0.04, 0.03,
0.13, 0.12, 0.09, 1.79, 1.76, 1.71, 1.68, 1.66, 1.65, 1.77, 1.71,
1.65, 0.03, 0.01, -0.01, -0.01, 0, 0, 0.07, 0.08, 0.07, 1.05,
1.02, 0.97, 0.94, 0.91, 0.9, 1.04, 0.99, 0.93, 0.26, 0.18, 0.15,
0.14, 0.17, 0.2, 0.34, 0.33, 0.29, 1.45, 1.42, 1.38, 1.35, 1.32,
1.31, 1.43, 1.38, 1.31, 0.51, 0.43, 0.37, 0.28, 0.24, 0.24, 0.57,
0.54, 0.5), ln_y = c(1.99, 2.02, 2.01, 2.06, 2.15, 2.25, 1.97,
1.96, 1.96, 2.22, 2.2, 2.18, 2.13, 2.09, 2.08, 2.17, 2.14, 2.11,
1.78, 1.78, 1.78, 1.77, 1.77, 1.77, 1.79, 1.79, 1.79, 2.19, 2.17,
2.14, 2.09, 2.05, 2.03, 2.15, 2.1, 2.06, 1.94, 1.94, 1.93, 1.93,
1.93, 1.93, 1.94, 1.94, 1.94, 2.2, 2.25, 2.23, 2.2, 2.13, 2.1,
2.13, 2.09, 2.08, 1.85, 1.85, 1.85, 1.84, 1.84, 1.84, 1.86, 1.86,
1.86, 2.09, 2.14, 2.14, 2.19, 2.2, 2.19, 2.02, 2.01, 1.99)), .Names = c("roi_size",
"depth", "Cl_0", "Cl_d", "Ch_d", "ln_x", "ln_y"), row.names = c(NA,
-72L), class = "data.frame")