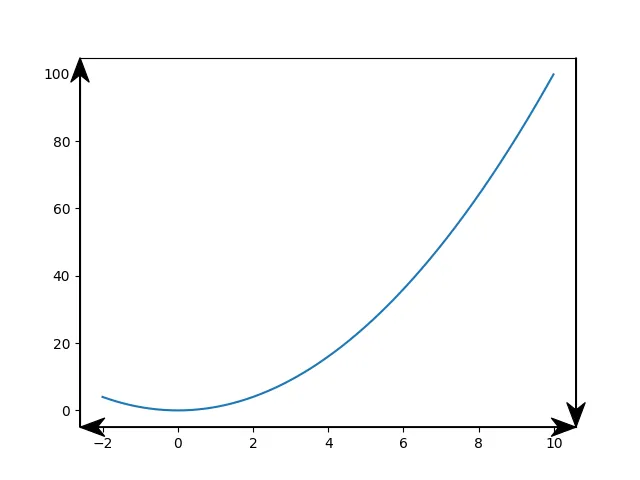
我正在尝试在Matplotlib中的坐标轴末尾设置一个箭头。 我不想删除脊柱并用纯箭头替换它们,因为我需要它们的功能...
import matplotlib.pyplot as plt
import numpy as np
def arrowed_spines(ax=None, arrowLength=30, labels=('X', 'Y'), arrowStyle='<|-'):
xlabel, ylabel = labels
for i, spine in enumerate(['left', 'bottom']):
# Set up the annotation parameters
t = ax.spines[spine].get_transform()
xy, xycoords = [1, 0], ('axes fraction', t)
xytext, textcoords = [arrowLength, 0], ('offset points', t)
# create arrowprops
arrowprops = dict( arrowstyle=arrowStyle,
facecolor=ax.spines[spine].get_facecolor(),
linewidth=ax.spines[spine].get_linewidth(),
alpha = ax.spines[spine].get_alpha(),
zorder=ax.spines[spine].get_zorder(),
linestyle = ax.spines[spine].get_linestyle() )
if spine is 'bottom':
ha, va = 'left', 'center'
xarrow = ax.annotate(xlabel, xy, xycoords=xycoords, xytext=xytext,
textcoords=textcoords, ha=ha, va='center',
arrowprops=arrowprops)
else:
ha, va = 'center', 'bottom'
yarrow = ax.annotate(ylabel, xy[::-1], xycoords=xycoords[::-1],
xytext=xytext[::-1], textcoords=textcoords[::-1],
ha='center', va=va, arrowprops=arrowprops)
return xarrow, yarrow
# plot
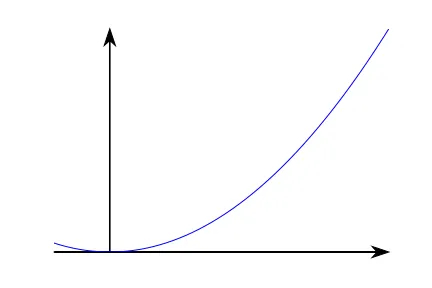
x = np.arange(-2., 10.0, 0.01)
plt.plot(x, x**2)
plt.gcf().set_facecolor('white')
ax = plt.gca()
ax.set_xticks([])
ax.set_yticks([])
ax.spines['left'].set_position('center')
ax.spines['right'].set_color('none')
ax.spines['bottom'].set_position('center')
ax.spines['top'].set_color('none')
arrowed_spines(ax)
plt.show()
图形结果显示箭头存在偏移,如下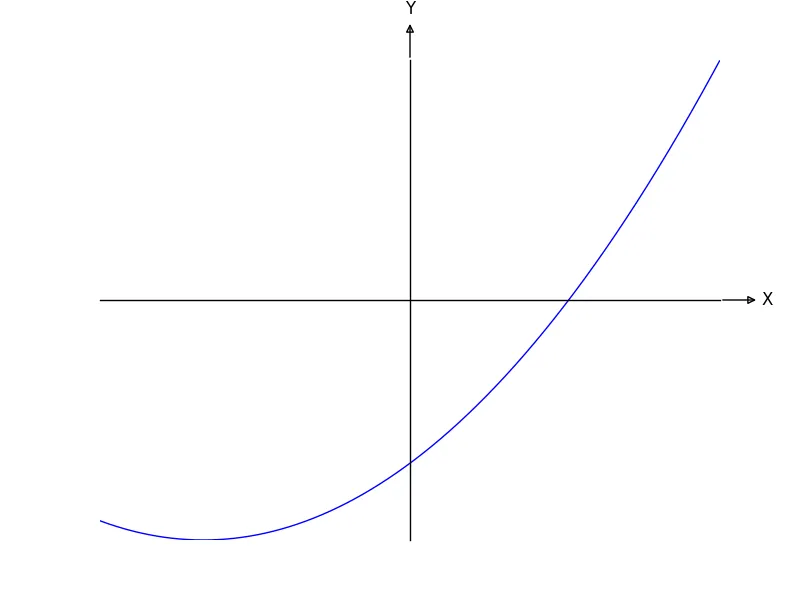
似乎起始位置和箭头与脊柱的对齐存在一到两个点的偏移。我不知道如何修复这个问题。
ax.spines['left'].set_position('zero')而不是ax.spines['left'].set_position('center'),这样坐标轴将在原点相交。 - charmoniumQax.spines['bottom'].set_position(('data', 0.001))- bytesinflight