有没有办法增加matplotlib streamplot中箭头的数量?目前每个流线似乎只有一个箭头,这是一个问题,如果我想更改x / y轴限制以缩放数据。
3个回答
6
在 @Richard_wth 的回答基础上,我编写了一个函数来控制流图上箭头的位置。可以选择每条流线上的 n 个箭头,或者选择使箭头在流线上等间距分布。
首先,您需要做一个正常的 streamplot,直到您对流线的位置和数量感到满意。保留返回的参数 sp。例如:
sp = ax.streamplot(x,y,u,v,arrowstyle='-',density=10)
重要的是要加上
arrowstyle='-',这样箭头就不会显示出来。然后,您可以调用下面提供的
streamQuiver函数来控制每条流线上的箭头。如果您想要每条流线有3个箭头:streamQuiver(ax, sp, n=3, ...)
如果您想要每 1.5 曲线长度优化流程:
streamQuiver(ax, sp, spacing=1.5, ...)
...是传递给quiver的选项。函数streamQuiver可能不是完全鲁棒的,可能需要针对特定情况进行一些额外处理。它依赖于4个子函数:
curve_coord用于获取路径沿着曲线长度的值curve_extract用于提取路径上等距点seg_to_lines将流图中的线段转化为连续线段。可能有更好的方法来实现这个功能!lines_to_arrows:这是提取每条线上箭头的主要函数
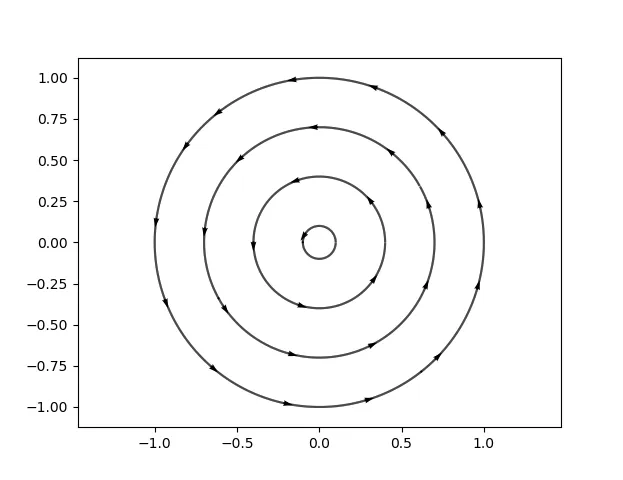
这里有一个例子,其中箭头位于每个流线上的等距点。
import numpy as np
import matplotlib.pyplot as plt

def streamQuiver(ax,sp,*args,spacing=None,n=5,**kwargs):
    """ Plot arrows from streamplot data
    The number of arrows per streamline is controlled either by `spacing` or by `n`.
    See `lines_to_arrows`.
    """
    def curve_coord(line=None):
        """ return curvilinear coordinate """
        x=line[:,0]
        y=line[:,1]
        s     = np.zeros(x.shape)
        s[1:] = np.sqrt((x[1:]-x[0:-1])**2+ (y[1:]-y[0:-1])**2)
        s     = np.cumsum(s)
        return s

    def curve_extract(line,spacing,offset=None):
        """ Extract points at equidistant space along a curve"""
        x=line[:,0]
        y=line[:,1]
        if offset is None:
            offset=spacing/2
        # Computing curvilinear length
        s = curve_coord(line)
        offset=np.mod(offset,s[-1]) # making sure we always get one point
        # New (equidistant) curvilinear coordinate
        sExtract=np.arange(offset,s[-1],spacing)
        # Interpolating based on new curvilinear coordinate
        xx=np.interp(sExtract,s,x);
        yy=np.interp(sExtract,s,y);
        return np.array([xx,yy]).T

    def seg_to_lines(seg):
        """ Convert a list of segments to a list of lines """
        def extract_continuous(i):
            x=[]
            y=[]
            # Special case, we have only 1 segment remaining:
            if i==len(seg)-1:
                x.append(seg[i][0,0])
                y.append(seg[i][0,1])
                x.append(seg[i][1,0])
                y.append(seg[i][1,1])
                return i,x,y
            # Looping on continuous segment
            while i<len(seg)-1:
                # Adding our start point
                x.append(seg[i][0,0])
                y.append(seg[i][0,1])
                # Checking whether next segment continues our line
                Continuous= all(seg[i][1,:]==seg[i+1][0,:])
                if not Continuous:
                    # We add our end point then
                    x.append(seg[i][1,0])
                    y.append(seg[i][1,1])
                    break
                elif i==len(seg)-2:
                    # we add the last segment
                    x.append(seg[i+1][0,0])
                    y.append(seg[i+1][0,1])
                    x.append(seg[i+1][1,0])
                    y.append(seg[i+1][1,1])
                i=i+1
            return i,x,y
        lines=[]
        i=0
        while i<len(seg):
            iEnd,x,y=extract_continuous(i)
            lines.append(np.array( [x,y] ).T)
            i=iEnd+1
        return lines

    def lines_to_arrows(lines,n=5,spacing=None,normalize=True):
        """ Extract "streamlines" arrows from a set of lines
        Either: `n` arrows per line
            or an arrow every `spacing` distance
        If `normalize` is true, the arrows have a unit length
        """
        if spacing is None:
            # if n is provided we estimate the spacing based on each curve lenght)
            spacing = [ curve_coord(l)[-1]/n for l in lines]
        try:
            len(spacing)
        except:
            spacing=[spacing]*len(lines)

        lines_s=[curve_extract(l,spacing=sp,offset=sp/2)         for l,sp in zip(lines,spacing)]
        lines_e=[curve_extract(l,spacing=sp,offset=sp/2+0.01*sp) for l,sp in zip(lines,spacing)]
        arrow_x  = [l[i,0] for l in lines_s for i in range(len(l))]
        arrow_y  = [l[i,1] for l in lines_s for i in range(len(l))]
        arrow_dx = [le[i,0]-ls[i,0] for ls,le in zip(lines_s,lines_e) for i in range(len(ls))]
        arrow_dy = [le[i,1]-ls[i,1] for ls,le in zip(lines_s,lines_e) for i in range(len(ls))]

        if normalize:
            dn = [ np.sqrt(ddx**2 + ddy**2) for ddx,ddy in zip(arrow_dx,arrow_dy)]
            arrow_dx = [ddx/ddn for ddx,ddn in zip(arrow_dx,dn)]
            arrow_dy = [ddy/ddn for ddy,ddn in zip(arrow_dy,dn)]
        return  arrow_x,arrow_y,arrow_dx,arrow_dy

    # --- Main body of streamQuiver
    # Extracting lines
    seg   = sp.lines.get_segments() # list of (2, 2) numpy arrays
    lines = seg_to_lines(seg)       # list of (N,2) numpy arrays
    # Convert lines to arrows
    ar_x, ar_y, ar_dx, ar_dy = lines_to_arrows(lines,spacing=spacing,n=n,normalize=True)
    # Plot arrows
    qv=ax.quiver(ar_x, ar_y, ar_dx, ar_dy, *args, angles='xy', **kwargs)
    return qv

# --- Example
x = np.linspace(-1,1,100)
y = np.linspace(-1,1,100)
X,Y=np.meshgrid(x,y)
u = -np.sin(np.arctan2(Y,X))
v =  np.cos(np.arctan2(Y,X))

xseed=np.linspace(0.1,1,4)

fig=plt.figure()
ax=fig.add_subplot(111)
sp = ax.streamplot(x,y,u,v,color='k',arrowstyle='-',start_points=np.array([xseed,xseed*0]).T,density=30)
qv = streamQuiver(ax,sp,spacing=0.5, scale=60)
plt.show()
- e-malito
3
我已经找到了一种自定义流线图箭头数量的方法。
这个想法是将流线和箭头分别绘制:
plt.streamplot返回一个流容器,其中包含两个属性:lines和arrows。lines包含可以用于重构没有箭头的流线的线段。plt.quiver可以用于绘制梯度场。通过适当的缩放,箭头的长度可以被忽略,只留下箭头头部。
因此,我们只需要使用线段定义箭头的位置并将其传递给 plt.quiver。
以下是一个玩具示例:
import matplotlib.pyplot as plt
from matplotlib import collections as mc
import numpy as np

# get line segments
fig = plt.figure()
ax = fig.add_subplot(1, 1, 1)
sp = ax.streamplot(x, y, u, v, start_points=start_points, density=10)
seg = sps.lines.get_segments()  # seg is a list of (2, 2) numpy arrays
lc = mc.LineCollection(seg, ...)

# define arrows
# here I define one arrow every 50 segments
# you could also select segs based on some criterion, e.g. intersect with certain lines
period = 50
arrow_x = np.array([seg[i][0, 0] for i in range(0, len(seg), period)])
arrow_y = np.array([seg[i][0, 1] for i in range(0, len(seg), period)])
arrow_dx = np.array([seg[i][1, 0] - seg[i][0, 0] for i in range(0, len(seg), period)])
arrow_dy = np.array([seg[i][1, 1] - seg[i][0, 1] for i in range(0, len(seg), period)])

# plot the final streamline
fig = plt.figure(figsize=(12.8, 10.8))
ax = fig.add_subplot(1, 1, 1)
ax.add_collection(lc)
ax.autoscale()
ax.quiver(
    arrow_x, arrow_y, arrow_dx, arrow_dy, angles='xy',  # arrow position
    scale=0.2, scale_units='inches', units='y', minshaft=0,  # arrow scaling
    headwidth=6, headlength=10, headaxislength=9)  # arrow style
fig.show()
有多种方法可以缩放箭头,使其看起来长度为零。
- Richard_wth
3
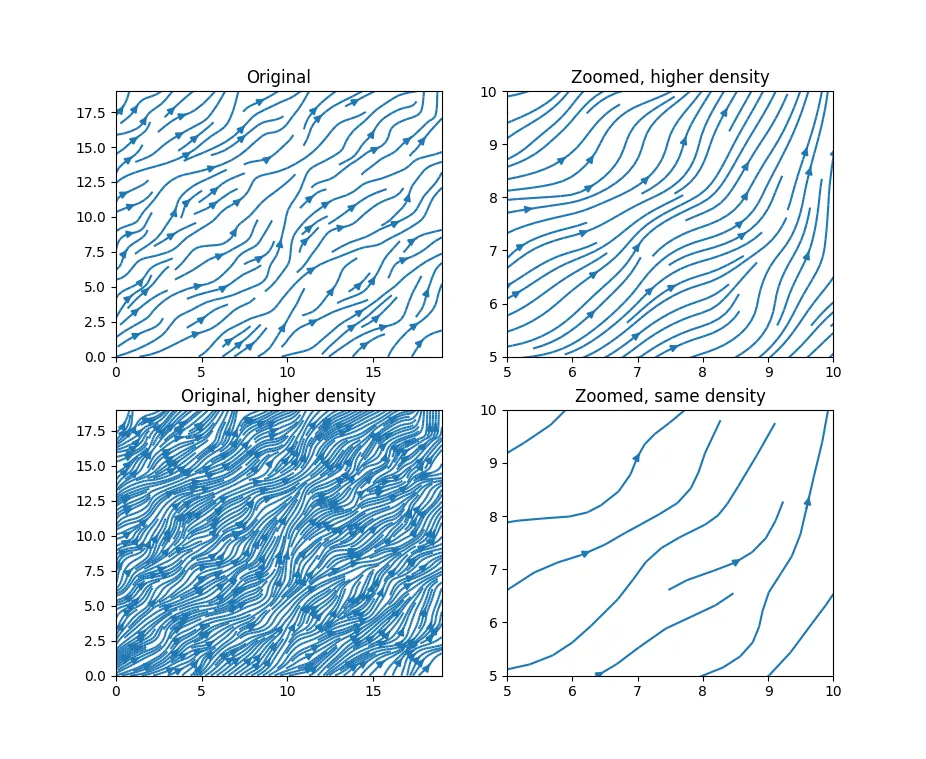
我不确定仅仅增加箭头的数量是否足够 - 但是您可以通过在 streamplot 函数中使用 density 参数来增加流线的密度,以下是文档:
*density* : float or 2-tuple
    Controls the closeness of streamlines. When `density = 1`, the domain
    is divided into a 30x30 grid---*density* linearly scales this grid.
    Each cell in the grid can have, at most, one traversing streamline.
    For different densities in each direction, use [density_x, density_y].
这是一个例子:
import matplotlib.pyplot as plt
import numpy as np

x = np.arange(0,20,1)
y = np.arange(0,20,1)

u=np.random.random((x.shape[0], y.shape[0]))
v=np.random.random((x.shape[0], y.shape[0]))


fig, ax = plt.subplots(2,2)

ax[0,0].streamplot(x,y,u,v,density=1)
ax[0,0].set_title('Original')

ax[0,1].streamplot(x,y,u,v,density=4)
ax[0,1].set_xlim(5,10)
ax[0,1].set_ylim(5,10)
ax[0,1].set_title('Zoomed, higher density')

ax[1,1].streamplot(x,y,u,v,density=1)
ax[1,1].set_xlim(5,10)
ax[1,1].set_ylim(5,10)
ax[1,1].set_title('Zoomed, same density')

ax[1,0].streamplot(x,y,u,v,density=4)
ax[1,0].set_title('Original, higher density')

fig.show()
- Robbie
网页内容由stack overflow 提供, 点击上面的可以查看英文原文,
原文链接
原文链接