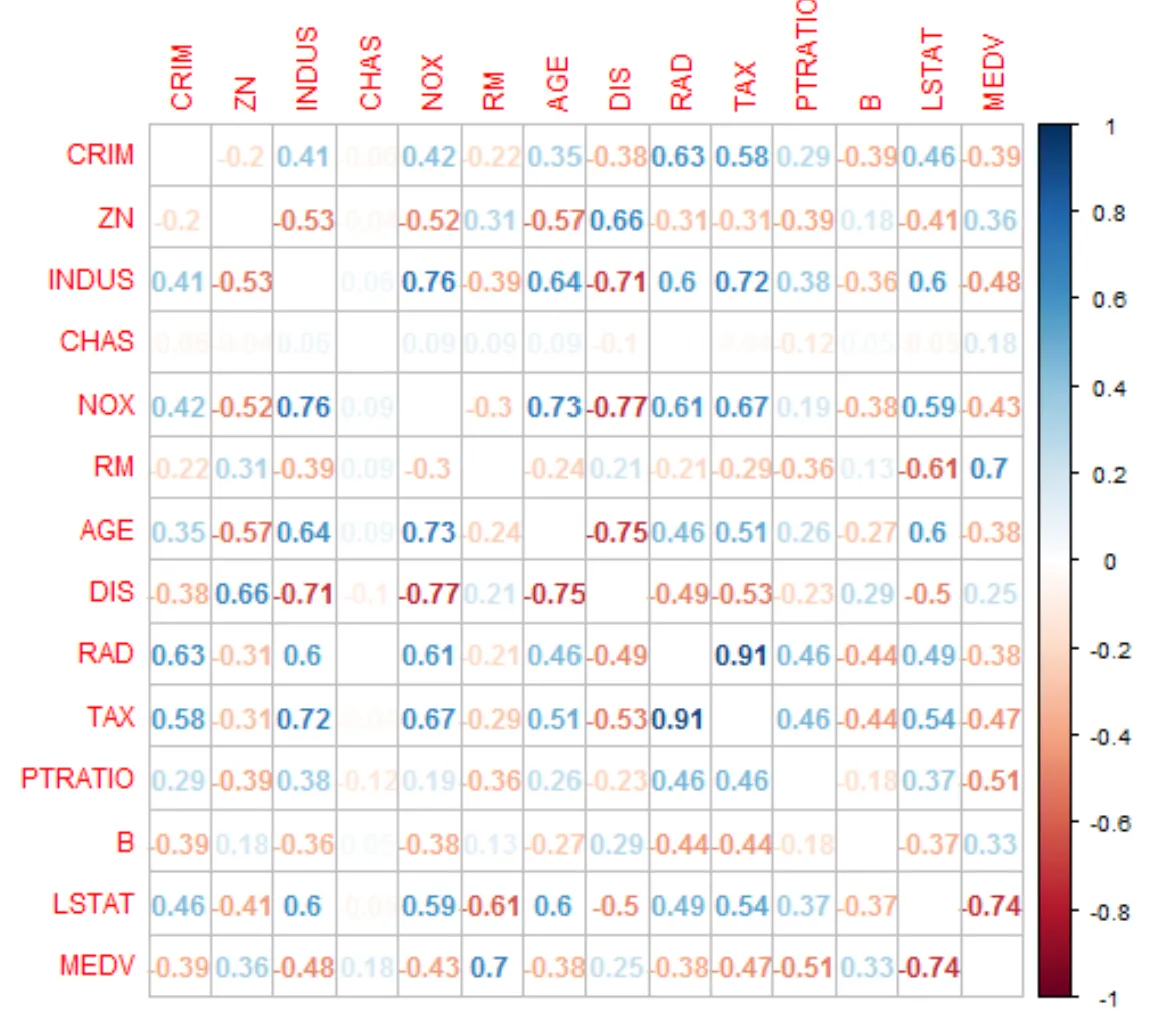
我正在尝试在MATLAB中生成这些漂亮的相关图。这些是使用R中的“corrplot”函数生成的,但是我找不到任何类似的MATLAB代码。欢迎任何帮助。
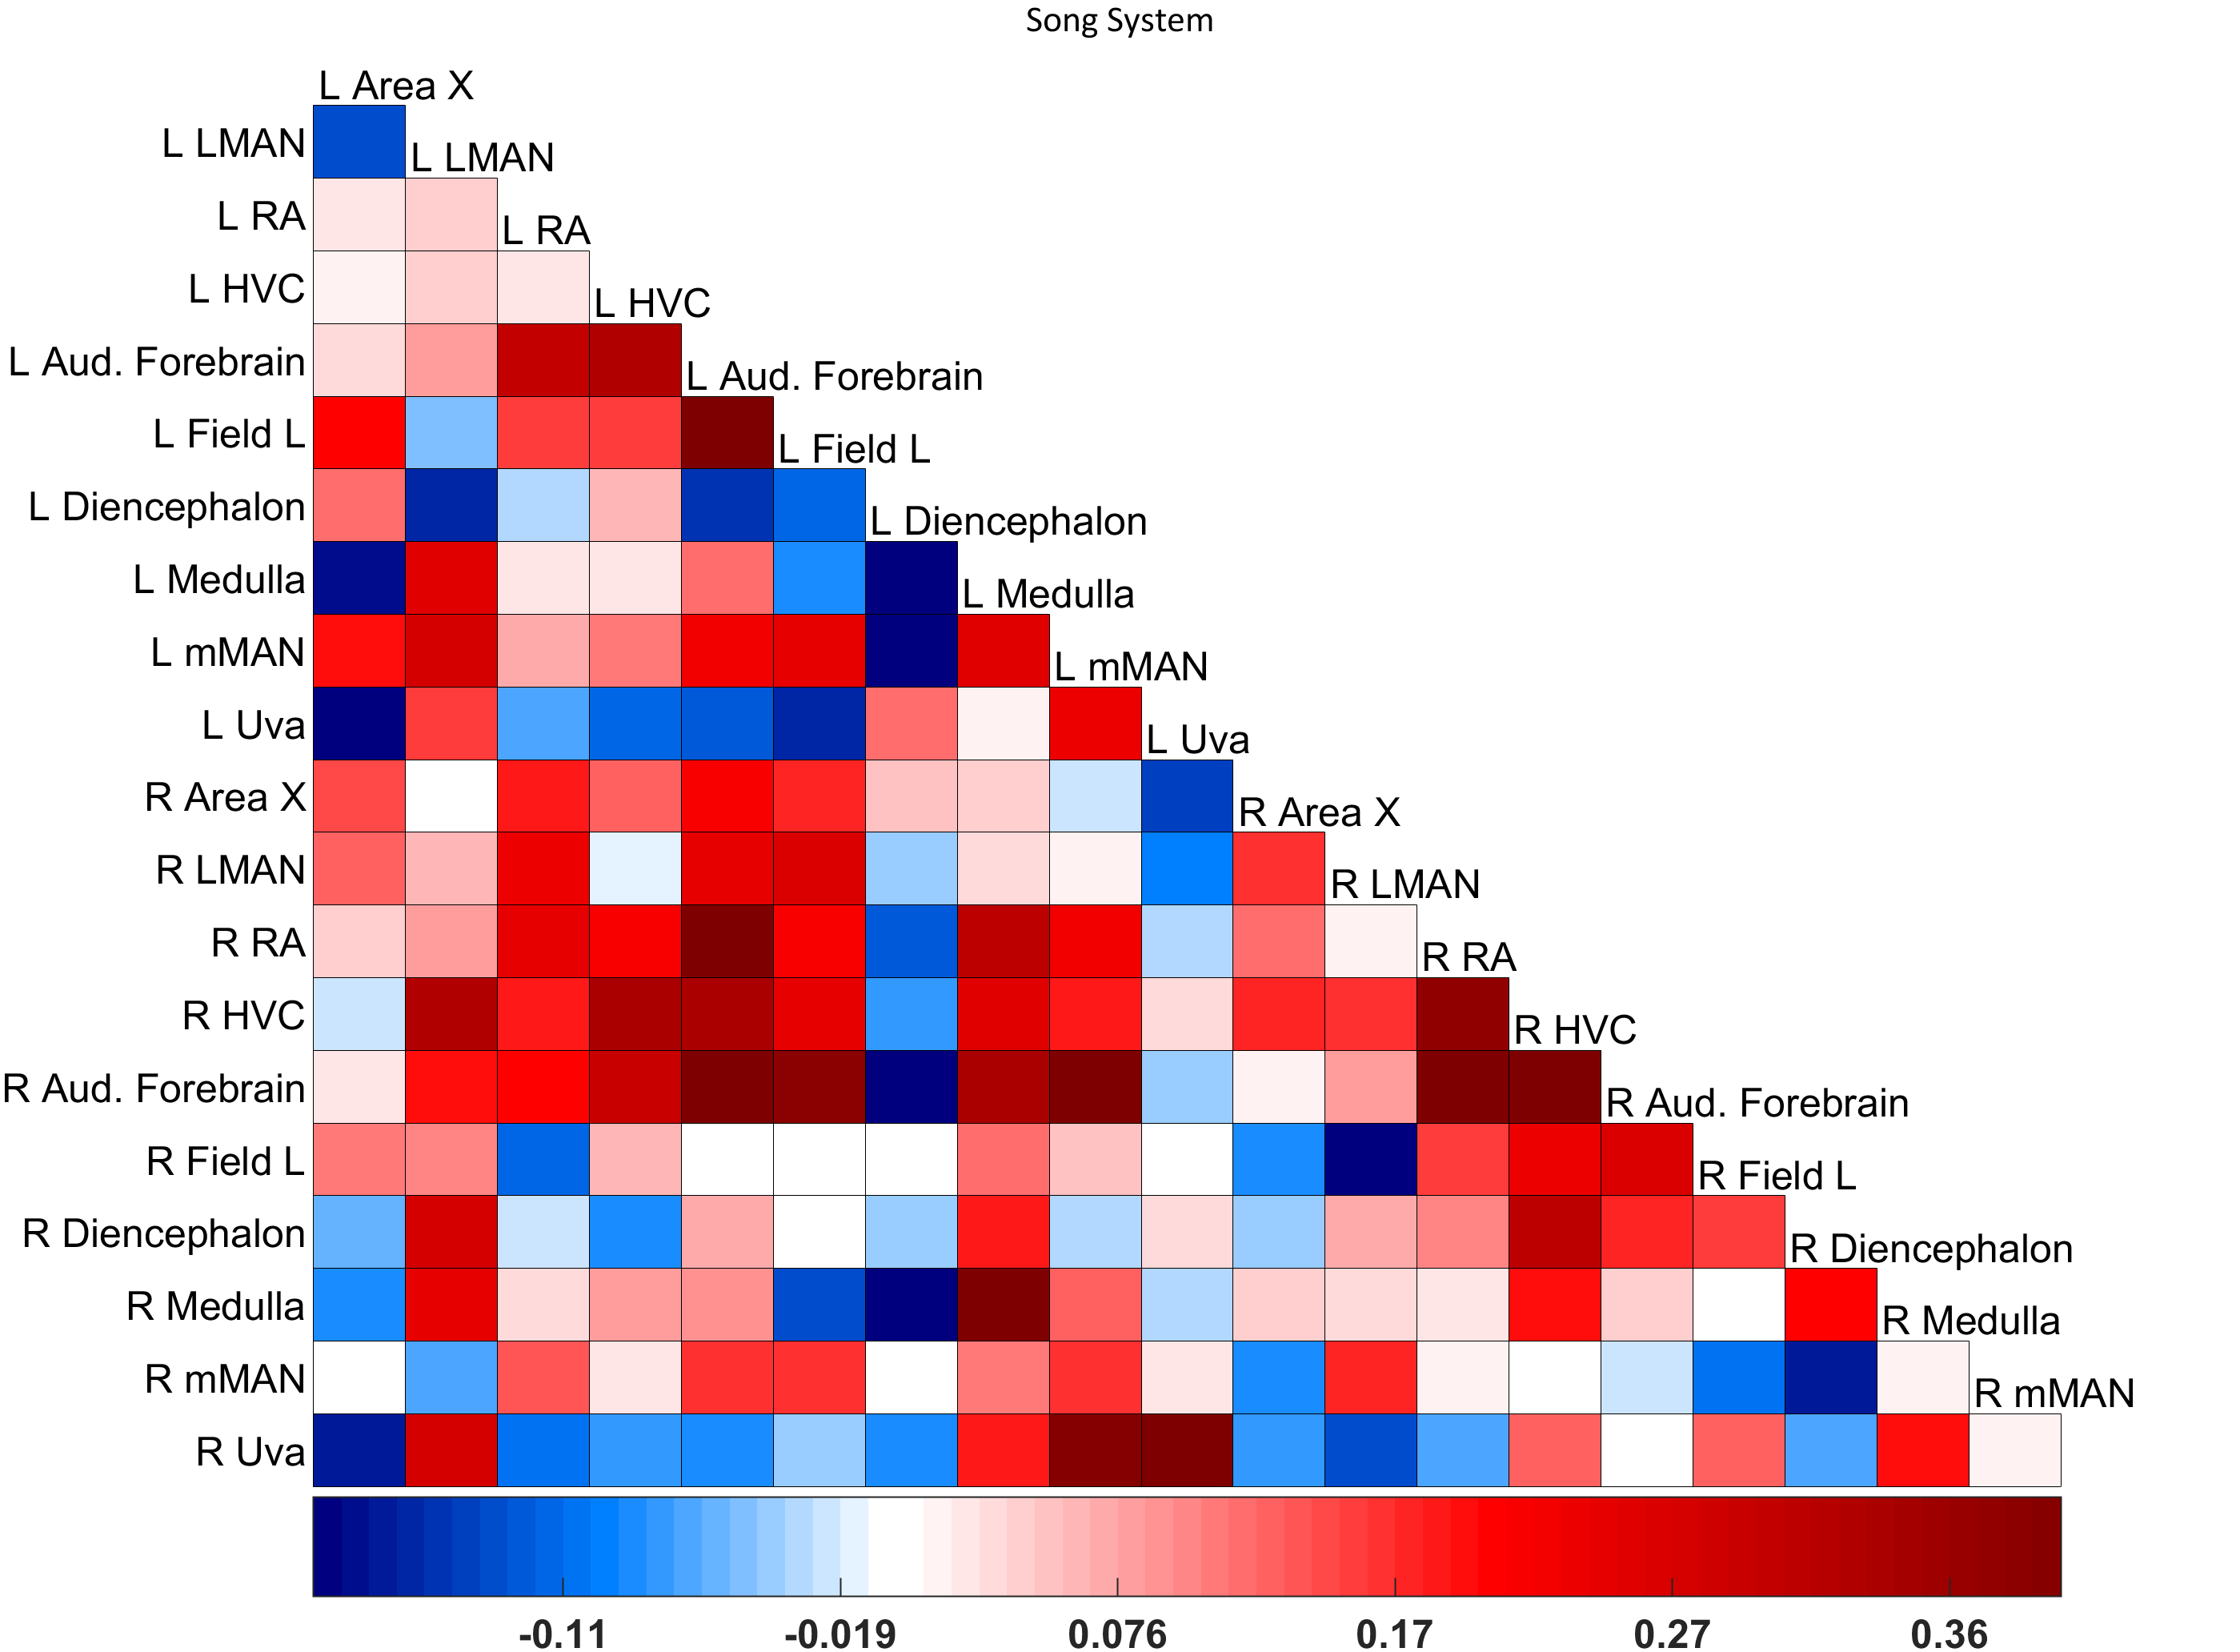
简单地说,此函数将创建一个相关值的颜色比例尺,并在相关矩阵/图的每个单元格中创建带有相应颜色的圆圈。圆的大小也表示相关性的大小,较大的圆表示更强的关系(正或负)。更多详细信息可以在这里找到。
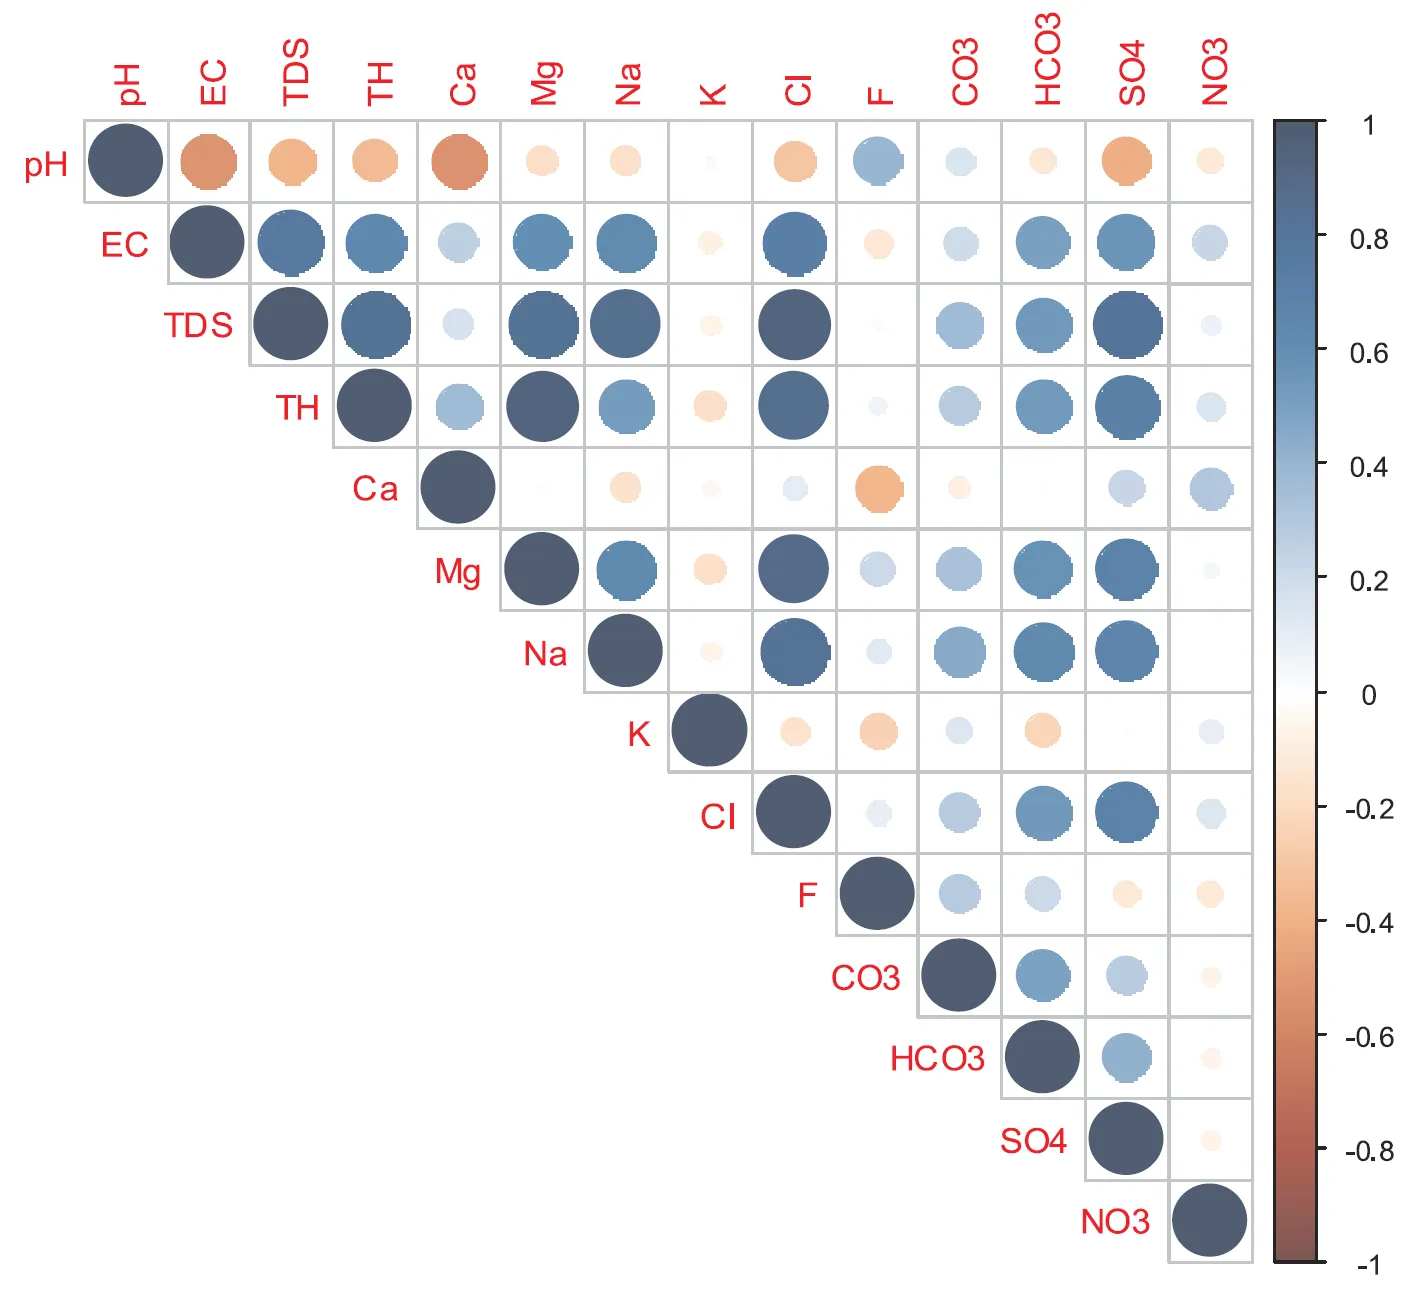
我正在尝试在MATLAB中生成这些漂亮的相关图。这些是使用R中的“corrplot”函数生成的,但是我找不到任何类似的MATLAB代码。欢迎任何帮助。
简单地说,此函数将创建一个相关值的颜色比例尺,并在相关矩阵/图的每个单元格中创建带有相应颜色的圆圈。圆的大小也表示相关性的大小,较大的圆表示更强的关系(正或负)。更多详细信息可以在这里找到。
 https://github.com/elayden/plot-corrmat
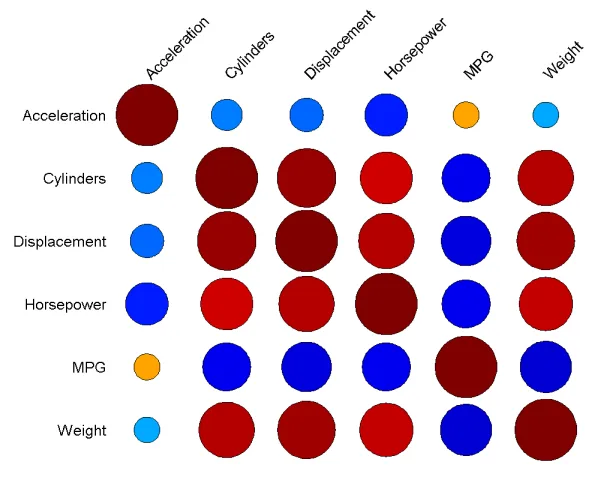
% Produce the input lower triangular matrix data
C = -1 + 2.*rand(12,12);
C = tril(C,-1);
C(logical(eye(size(C)))) = 1;
% Set [min,max] value of C to scale colors
clrLim = [-1,1];
% load('CorrColormap.mat') % Uncomment for custom CorrColormap
% Set the  [min,max] of diameter where 1 consumes entire grid square
diamLim = [0.1, 1];
myLabel = {'ICA','Elev','Pr','Rmax','Rmin','Srad','Wspd','Tmin','Tmax','VPD','ET_o','AW'};
% Compute center of each circle
% This assumes the x and y values were not entered in imagesc()
x = 1 : 1 : size(C,2); % x edges
y = 1 : 1 : size(C,1); % y edges
[xAll, yAll] = meshgrid(x,y);
xAll(C==0)=nan; % eliminate cordinates for zero correlations
% Set color of each rectangle
% Set color scale
cmap = jet(256);
% cmap = CorrColormap; % Uncomment for CorrColormap
Cscaled = (C - clrLim(1))/range(clrLim); % always [0:1]
colIdx = discretize(Cscaled,linspace(0,1,size(cmap,1)));
% Set size of each circle
% Scale the size between [0 1]
Cscaled = (abs(C) - 0)/1;
diamSize = Cscaled * range(diamLim) + diamLim(1);
% Create figure
fh = figure();
ax = axes(fh);
hold(ax,'on')
colormap(ax,'jet');
% colormap(CorrColormap) %Uncomment for CorrColormap
tickvalues = 1:length(C);
x = zeros(size(tickvalues));
text(x, tickvalues, myLabel, 'HorizontalAlignment', 'right');
x(:) = length(C)+1;
text(tickvalues, x, myLabel, 'HorizontalAlignment', 'right','Rotation',90);
% Create circles
theta = linspace(0,2*pi,50); % the smaller, the less memory req'd.
h = arrayfun(@(i)fill(diamSize(i)/2 * cos(theta) + xAll(i), ...
    diamSize(i)/2 * sin(theta) + yAll(i), cmap(colIdx(i),:),'LineStyle','none'),1:numel(xAll));
axis(ax,'equal')
axis(ax,'tight')
set(ax,'YDir','Reverse')
colorbar()
caxis(clrLim);
axis off
这里有精确的图表: MATLAB中的华丽相关图表
.R脚本来绘制图,并从 MATLAB 中调用它。 - ThomasIsCoding