2D插值与周期边界条件

7

我正在对一个具有周期边界条件的二维空间进行模拟。连续函数由其在网格上的值表示。我需要能够在空间中的任何点上评估函数及其梯度。从根本上讲,这不是一个难题——或者更准确地说,这几乎已经是一个解决的问题。可以使用scipy.interpolate.RectBivariateSpline的三次样条插值来插值函数。问题的关键在于RectBivariateSpline不能处理周期边界条件,从文档中我也没有找到scipy.interpolate中可以处理此类问题的工具。

是否有Python包可以解决这个问题?如果没有,我能否改进scipy.interpolate以处理周期边界条件?例如,在整个空间周围放置四个网格元素的边框并明确表示周期条件是否足够?

[补充说明] 如果有用的话,以下是更多详细信息:我正在模拟动物在化学梯度中的运动。上述连续函数是它们被吸引的化学物质的浓度。它根据简单的反应/扩散方程式随时间和空间变化。每只动物都有一个x,y位置(不能假定在网格点上)。它们朝着吸引物质的梯度移动。我使用周期边界条件来简单地模拟一个无限空间。


样条曲线本质上不是周期性的 - 你不能用一组正弦/余弦函数来拟合吗? - mdurant
当然,如果我想从头开始编写自己的插值器,我可以这样做。但是,如果我要从头开始编写自己的插值器,我也可以编写一个适用于周期边界的样条插值器。很容易看出如何做到这一点。如果必须这样做,我会的。但是,我更愿意使用由专业人员编写的经过良好设计、优化和维护的软件包。 - Leon Avery
你可以创建一个3x3的复制网格,在这个扩展的网格上执行插值,然后只返回中间的单元格。 - Lukasz Wiklendt
4个回答

8

看起来最接近的Python函数是scipy.signal.cspline2d。这正是我想要的,但是它假定镜像对称边界条件。因此,我有三个选择:

  1. 编写自己的三次样条插值函数,支持周期性边界条件,可以以cspline2d源代码(基于C语言编写的函数)作为起点。

  2. 权宜之计:数据在i处对j处样条系数的影响随r^|i-j|变化,其中r=-2+sqrt(3)约等于-0.26。因此,如果我将网格嵌套在一个宽度为20的边框内,并复制周期性值,则边缘的影响会降至r^20约等于10^-5,类似于这样:

    bzs1 = np.array( [zs1[i%n,j%n] for i in range(-20, n+20) for j in range(-20, n+20)] )
    bzs1 = bzs1.reshape((n + 40, n + 40))

    然后我在整个数组上调用cspline2d,但只使用中间部分。这应该能行,但很丑陋。

  3. 改用Hermite插值。在二维正则网格中,这对应于双三次插值。缺点是插值函数具有不连续的二阶导数。优点是它(1)相对容易编码,(2)对于我的应用程序而言,计算效率高。目前,这是我青睐的解决方案。

我按照 @mdurant 的建议,计算了三角函数插值而非多项式插值。结果与三次样条函数非常相似,但需要更多的计算并产生更差的结果,因此我不会这样做。
编辑:一位同事告诉我第四种解决方案:
1. GNU Scientific Library(GSL)具有可以处理周期性边界条件的插值函数。有两个(至少)python接口可用于GSL:PyGSLCythonGSL。不幸的是,GSL插值似乎仅限于一维,所以对我来说没有太多用处,但在GSL中有很多好东西。

1
另一个可行的函数是scipy.ndimage.interpolation.map_coordinates,它使用周期边界条件进行样条插值。它不直接提供导数,但可以通过数值计算来计算导数。

然而,请注意周期边界条件的惯例可能不是您所期望的:https://dev59.com/Uqnka4cB1Zd3GeqPT8xt - shoyer

0

这些函数可以在我的github上找到,master/hmc/lattice.py

  • 周期边界条件 完整的Periodic_Lattice()类在这里描述。
  • 晶格导数 在代码库中,您将找到一个拉普拉斯函数、一个平方梯度(对于梯度只需取平方根)和一个重载版本的np.ndarray
  • 单元测试 测试用例可以在同一代码库中的tests/test_lattice.py中找到

0

我一直在使用以下函数,它增强了输入数据以创建具有有效周期边界条件的数据。增强数据相对于修改现有算法具有明显优势:增强数据可以使用任何算法轻松地进行插值。请参见下面的示例。

def augment_with_periodic_bc(points, values, domain):
    """
    Augment the data to create periodic boundary conditions.

    Parameters
    ----------
    points : tuple of ndarray of float, with shapes (m1, ), ..., (mn, )
        The points defining the regular grid in n dimensions.
    values : array_like, shape (m1, ..., mn, ...)
        The data on the regular grid in n dimensions.
    domain : float or None or array_like of shape (n, )
        The size of the domain along each of the n dimenions
        or a uniform domain size along all dimensions if a 
        scalar. Using None specifies aperiodic boundary conditions.

    Returns
    -------
    points : tuple of ndarray of float, with shapes (m1, ), ..., (mn, )
        The points defining the regular grid in n dimensions with 
        periodic boundary conditions.
    values : array_like, shape (m1, ..., mn, ...)
        The data on the regular grid in n dimensions with periodic
        boundary conditions.
    """
    # Validate the domain argument
    n = len(points)
    if np.ndim(domain) == 0:
        domain = [domain] * n
    if np.shape(domain) != (n,):
        raise ValueError("`domain` must be a scalar or have the same "
                         "length as `points`")

    # Pre- and append repeated points
    points = [x if d is None else np.concatenate([x - d, x, x + d]) 
              for x, d in zip(points, domain)]

    # Tile the values as necessary
    reps = [1 if d is None else 3 for d in domain]
    values = np.tile(values, reps)

    return points, values
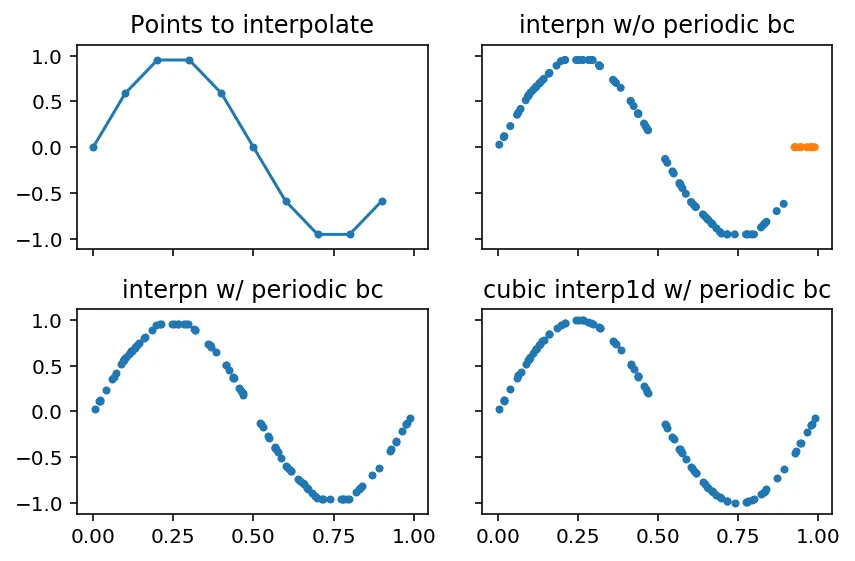
示例

下面的示例展示了在一维周期边界条件下的插值,但上面的函数可以应用于任意维度。

example of periodic interpolation

rcParams['figure.dpi'] = 144
fig, axes = plt.subplots(2, 2, True, True)

np.random.seed(0)
x = np.linspace(0, 1, 10, endpoint=False)
y = np.sin(2 * np.pi * x)
ax = axes[0, 0]
ax.plot(x, y, marker='.')
ax.set_title('Points to interpolate')

sampled = np.random.uniform(0, 1, 100)
y_sampled = interpolate.interpn([x], y, sampled, bounds_error=False)
valid = ~np.isnan(y_sampled)
ax = axes[0, 1]
ax.scatter(sampled, np.where(valid, y_sampled, 0), marker='.', c=np.where(valid, 'C0', 'C1'))
ax.set_title('interpn w/o periodic bc')

[x], y = augment_with_periodic_bc([x], y, domain=1.0)
y_sampled_bc = interpolate.interpn([x], y, sampled)
ax = axes[1, 0]
ax.scatter(sampled, y_sampled_bc, marker='.')
ax.set_title('interpn w/ periodic bc')

y_sampled_bc_cubic = interpolate.interp1d(x, y, 'cubic')(sampled)
ax = axes[1, 1]
ax.scatter(sampled, y_sampled_bc_cubic, marker='.')
ax.set_title('cubic interp1d w/ periodic bc')

fig.tight_layout()

嗨,希望你一切都好。我目前也遇到了同样的问题。如何使值f[0]=f[2pi]。这是可以做到的,但导数显然是不连续的。你的函数能否使导数连续? - Alexander Cska

网页内容由stack overflow 提供, 点击上面的
可以查看英文原文,
原文链接