我使用过两种方法:
library('ggplot2')
counts <- with(diamonds, table(cut, clarity))
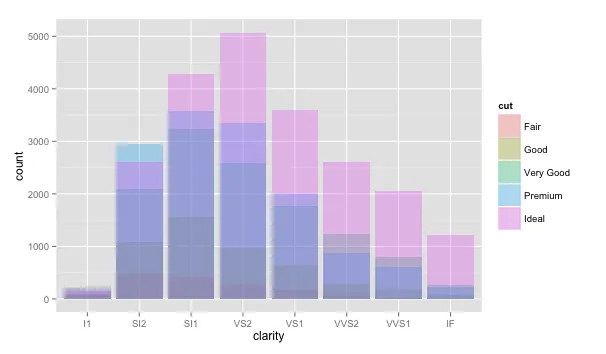
在 ggplot 中,这非常容易
ggplot(diamonds, aes(clarity, fill = cut)) +
  geom_bar(position = 'identity', alpha = 0.3)
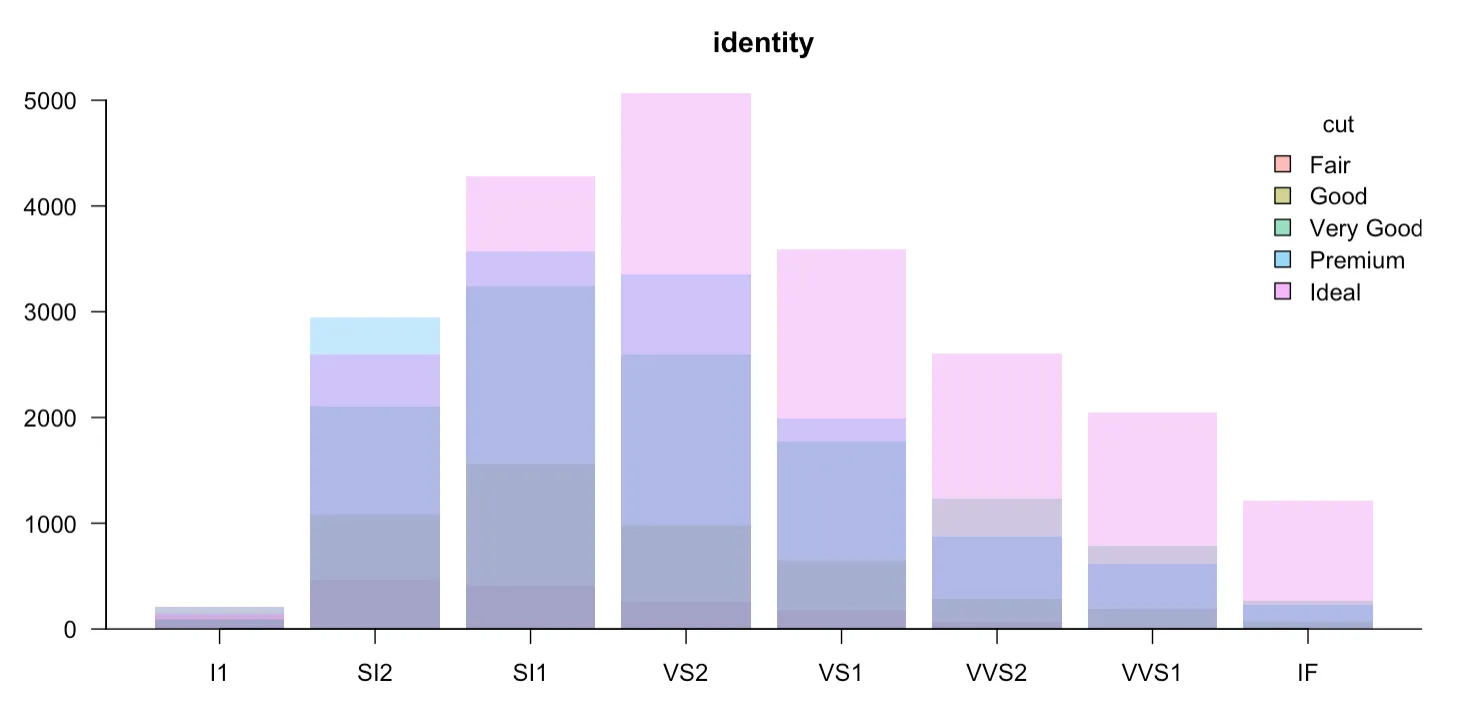
使用基本R语言实现
cols <- ggcols(nrow(counts))

for (ii in 1:nrow(counts))
  barplot(counts[ii, ], add = ii != 1, ylim = c(0, 5000),
          col = adjustcolor(cols[ii], 0.3),
          axes = FALSE, axisnames = FALSE, border = NA)

axis(1, barplot(counts, plot = FALSE), colnames(counts))
axis(2, las = 1)
title(main = 'identity')
box(bty = 'l')

legend('topright', bty = 'n', title = 'cut',
       legend = rownames(counts), fill = adjustcolor(cols, 0.5))
同时匹配ggplot颜色:
ggcols <- function (n, l = 65, c = 100) {
  hues <- seq(15, 375, length = n + 1)
  hcl(h = hues, l = l, c = c)[1:n]
}
barplot(as.matrix(dat), beside=TRUE)这样的东西吗? - tkerwin