使用igraph在R中绘制多个离散网络

5

我有一组简单的方向关系(父->子)想要绘制。我的数据结构是这样的,有许多离散的子网络。以下是一个类似于我的假数据。

require(igraph)
parents<-c("A","A","C","C","F","F","H","I")
children<-c("B","C","D","E","G","H","I","J")
begats<-data.frame(parents=parents,children=children)
graph_begats<-graph.data.frame(begats)
plot(graph_begats)

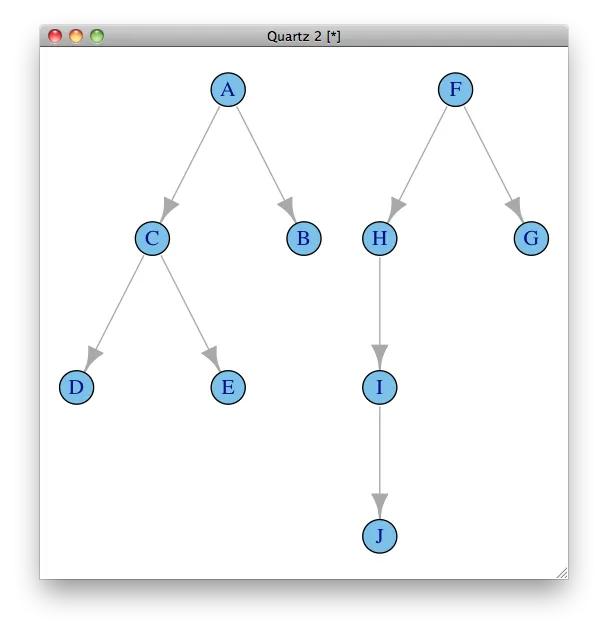
假数据中有两个不同的子网络,每个子网络都是严格的父-子血统。我需要在同一个窗口中(理想情况下使用相同的顶点坐标系统)将这两个血统作为树形网络绘制出来。我尝试使用layout.reingold.tilford(),但最多只能绘制一棵树,所有其他顶点都绘制在根顶点之上,如下所示。

lo<-layout.reingold.tilford(graph_begats,root=1)
plot(graph_begats,layout=lo)

有没有关于对任意数量的离散谱系进行此操作的想法?

如果我能够弄清楚如何 A) 计算数据集中离散谱系的数量,并且 B) 为每个顶点分配其谱系,我将完成我问题解决的75%。 - Andrew Barr
1
使用 clusters()decompose.graph() 将网络拆分,然后为每个部分单独计算布局,最后通过移动一个布局矩阵将它们合并。 - Gabor Csardi
是的!decompose.graph()就是我需要的。矩阵移位还在努力中,但我正在接近目标。 - Andrew Barr
为了正确使用layout.reingold.tilford()获取树形布局,我需要一个识别根节点的方法。我通过采用topological sort()函数返回的第一个顶点来实现这一点,如topological.sort(theGraph)[1]所示。这在我的示例数据中的子图中并不是必需的,但通常在真实数据中是必需的。 - Andrew Barr
1个回答

6
所以,正如我在上面的评论中提到的,一种解决方案是为每个组件单独计算布局。即使需要编写一些代码来正确执行此操作,但它相当简单。下面的代码应该适用于任意数量的组件。在拓扑排序中,第一个顶点被用作每棵树的根节点。
require(igraph)

## Some data
parents <- c("A", "A", "C", "C", "F", "F", "H", "I")
children <- c("B", "C", "D", "E", "G", "H", "I", "J")
begats <- data.frame(parents=parents, children=children)
graph_begats <- graph.data.frame(begats)

## Decompose the graph, individual layouts
comp <- decompose.graph(graph_begats)
roots <- sapply(lapply(comp, topological.sort), head, n=1)
coords <- mapply(FUN=layout.reingold.tilford, comp,
                 root=roots, SIMPLIFY=FALSE)

## Put the graphs side by side, roots on the top
width <- sapply(coords, function(x) { r <- range(x[, 1]); r[2] - r[1] })
gap <- 0.5
shift <- c(0, cumsum(width[-length(width)] + gap))
ncoords <- mapply(FUN=function(mat, shift) {
  mat[,1] <- mat[,1] - min(mat[,1]) + shift
  mat[,2] <- mat[,2] - max(mat[,2])
  mat
}, coords, shift, SIMPLIFY=FALSE)

## Put together the coordinates for the original graph,
## based on the names of the vertices
lay <- matrix(0, ncol=2, nrow=vcount(graph_begats))
for (i in seq_along(comp)) {
  lay[match(V(comp[[i]])$name, V(graph_begats)$name),] <- ncoords[[i]]
}

## Plot everything
par(mar=c(0,0,0,0))
plot(graph_begats, layout=lay)

plot


非常感谢,Gabor。这正是它的原意! - Andrew Barr

网页内容由stack overflow 提供, 点击上面的
可以查看英文原文,
原文链接