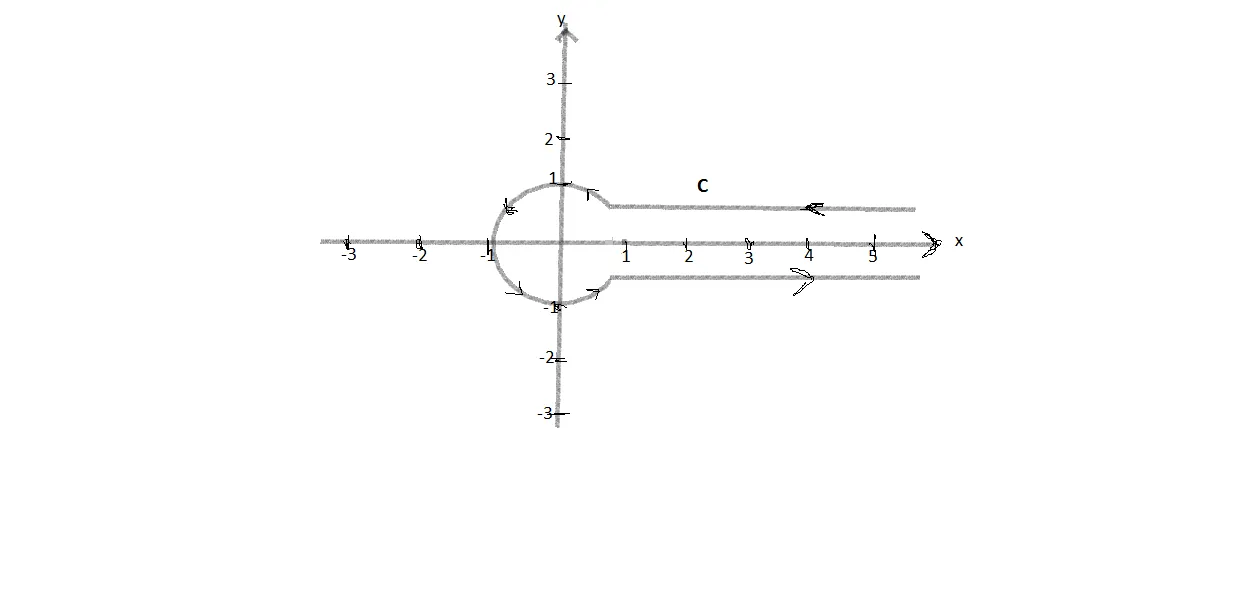
我该如何在Mathematica中编写类似于这个(复杂轮廓)函数的代码:
我不确定c具体是什么,但我假设它是一个介于0和1之间的数字,表示传入直线的高度。因此,也许像这样的内容适合您的需求?
c = 0.7;
t0 = ArcSin[c];
PolarPlot[If[Abs[t] < t0, Abs[Sin[t0]/Sin[t]], 1], {t, -\[Pi], \[Pi]}]
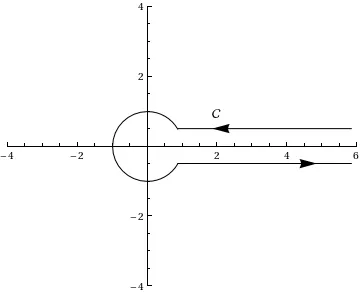
c 只是一个标签(通常在书籍等中称为积分轮廓 c)。您可以使用此软件包轻松地向轮廓添加箭头:http://users.dimi.uniud.it/~gianluca.gorni/Mma/Mma.html - aclPolarPlot解决方案)。With[{q = Pi/6},
Graphics[{Circle[{0, 0}, 1, {q, 2 Pi - q}],
Arrowheads[{{.05, .8}}],
Arrow[{{Cos[q] + 2, Sin[q]}, {Cos[q], Sin[q]}}],
Arrow[{{Cos[q], Sin[-q]}, {Cos[q] + 2, Sin[-q]}}],
FontSize -> Medium, Text["\[ScriptCapitalC]", {2, Sin[q]}, {0, -2}]},
Axes -> True, PlotRange -> {{-4, 6}, {-4, 4}}]]
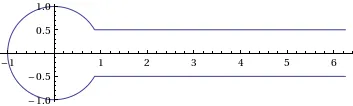
如果你想要contour函数的实际功能,那么可能像这样:
contour[t_, t0_: (5 Pi/6)] := Piecewise[{
   {Exp[I (t + Pi)], -t0 < t < t0},
   {t - t0 + Exp[I (t0 + Pi)], t >= t0},
   {-t - t0 + Exp[-I (t0 + Pi)], t <= -t0}}]

ParametricPlot[Through[{Re, Im}[contour[t]]], {t, -8, 8}, PlotPoints -> 30]
如果想在这个图表中添加箭头,我猜您需要手动添加它们(使用Epilog或绘图工具),或使用修改内置图表的包之一。
f[x_ /; x > 0] := x^2; f[x_ /; x < 0] := 1 - x;就可以完成任务。 - acl