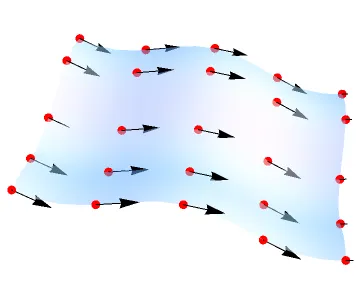
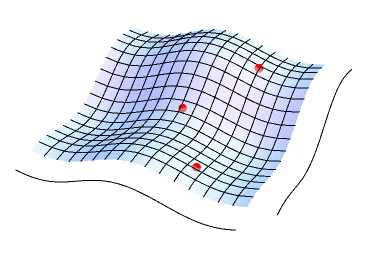
也许这会帮助您开始解决问题。它在表面上绘制了三个随机点。您可以通过设置nPoints来更改点数。我不知道如何沿x轴绘制切线。但是当您弄清楚后,可以使用箭头,正如@Verbeia建议的那样。
nPoints = 3;
Show[ParametricPlot3D[{
       {u, v, (Cos[u] + Cos[v])/3},
       {u, -1, (Cos[u] + Cos[0])/3}, {5,  v, (Cos[4] + Cos[v])/3}},
       {u, -4, 4}, {v, 0, 8}, Axes -> False,
       Boxed -> False, BoxRatios -> {8, 8, 1.5},
       PlotStyle -> Directive[Opacity[0.5]]],

     Graphics3D[{Red, PointSize[.025],
         Point[Table[{u1 = RandomReal[{-3, 3}], v1 = RandomReal[{1, 7}],
         (Cos[u1] + Cos[v1])/3}, {nPoints}]]}]]
编辑
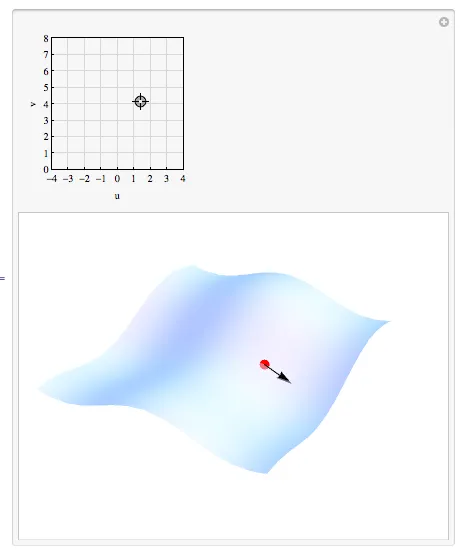
以下动态变化使用了 @belisarius 的贡献:
Manipulate[
Show[ParametricPlot3D[{{u, v, (Cos[u] + Cos[v])/3} },
  {u, -4, 4}, {v, 0, 8}, Axes -> False, Boxed -> False,
  BoxRatios -> {8, 8, 1.5},
  Mesh -> None,
  ImageSize -> {400, 300},
  PlotRange -> {{-4, 4}, {0, 8}},
  PlotRangePadding -> {{0, 1.4}, {0, 0}},
  PlotStyle -> Directive[Opacity[0.5]]],
Graphics3D[({Red, PointSize[.025],
  Point@f[pt[[1, 1]], pt[[1, 2]]], Black,
  Arrow[{f[pt[[1, 1]], pt[[1, 2]]],
  f[pt[[1, 1]], pt[[1, 2]]] + D[f[t, pt[[1, 2]]], t] /.
   t -> pt[[1, 1]]}]}]],
Grid[{{
  LocatorPane[Dynamic[pt],
  Dynamic[Graphics[{},
   PlotRange -> {{-4, 4}, {0, 8}},
   Frame -> True,
   ImageSize -> 160,
   FrameTicks -> {Range[-4, 4], Range[0, 8], None, None},
   FrameLabel -> {"u", "v"},
   GridLines -> {Range[-4, 4], Range[0, 8]},
   GridLinesStyle -> Directive[LightGray]]],
   {{-4, 0}, {4, 8}}]}}],
  {{pt, {{1, 2}}}, ControlType -> None},

  Initialization :> {f[u_, v_] := {u, v, (Cos[u] + Cos[v])/3};}]