在Matplotlib 3D表面上应用色图到自定义轴

3

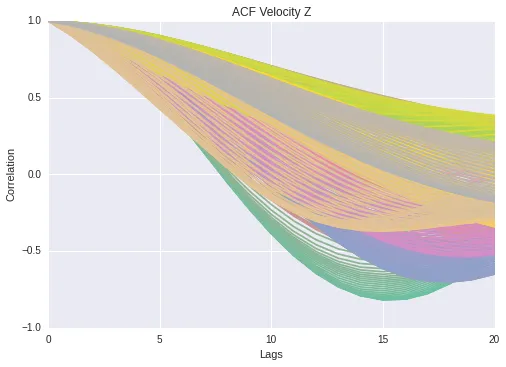
我有一些时间序列数据,已经分成了数百块。我解决了每个片段的自相关性,并将它们绘制出来:

# plot superimposed
fig = plt.figure()
color = iter(plt.cm.Set2(np.linspace(0,1,num_segs)))
seg_iterator = df.iterrows() 
for index, seg in seg_iterator: # iterate over dataframe
    c=next(color)
    sns.plt.plot(seg, color=c)

自相关系数图

接下来,我将它们绘制成3D表面图:

# plot as a surface
surfacefig = plt.figure()
surfaceax = surfacefig.gca(projection='3d')
X = np.arange(LAGS+1)
Y = np.arange(num_segs)
X, Y = np.meshgrid(X, Y)
surfaceax.plot_surface(X, Y, df, cmap=plt.cm.Set2)
plt.show()

3D表面

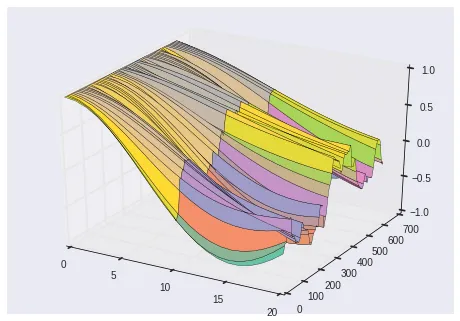
如何将颜色映射到行索引(而不是z值)?我希望保留线的颜色。


更新结果:

# updated lines. Make sure XX and YY are floats
surf = surfaceax.plot_surface(XX, YY, df, shade=False,
             facecolors=plt.cm.Set2((YY-YY.min()) / (YY.max()-YY.min())), 
             cstride=1, rstride=5, alpha=0.7)
plt.draw() # you need this to get the edge color
line = np.array(surf.get_edgecolor())
surf.set_edgecolor(line*np.array([0,0,0,0])+1)
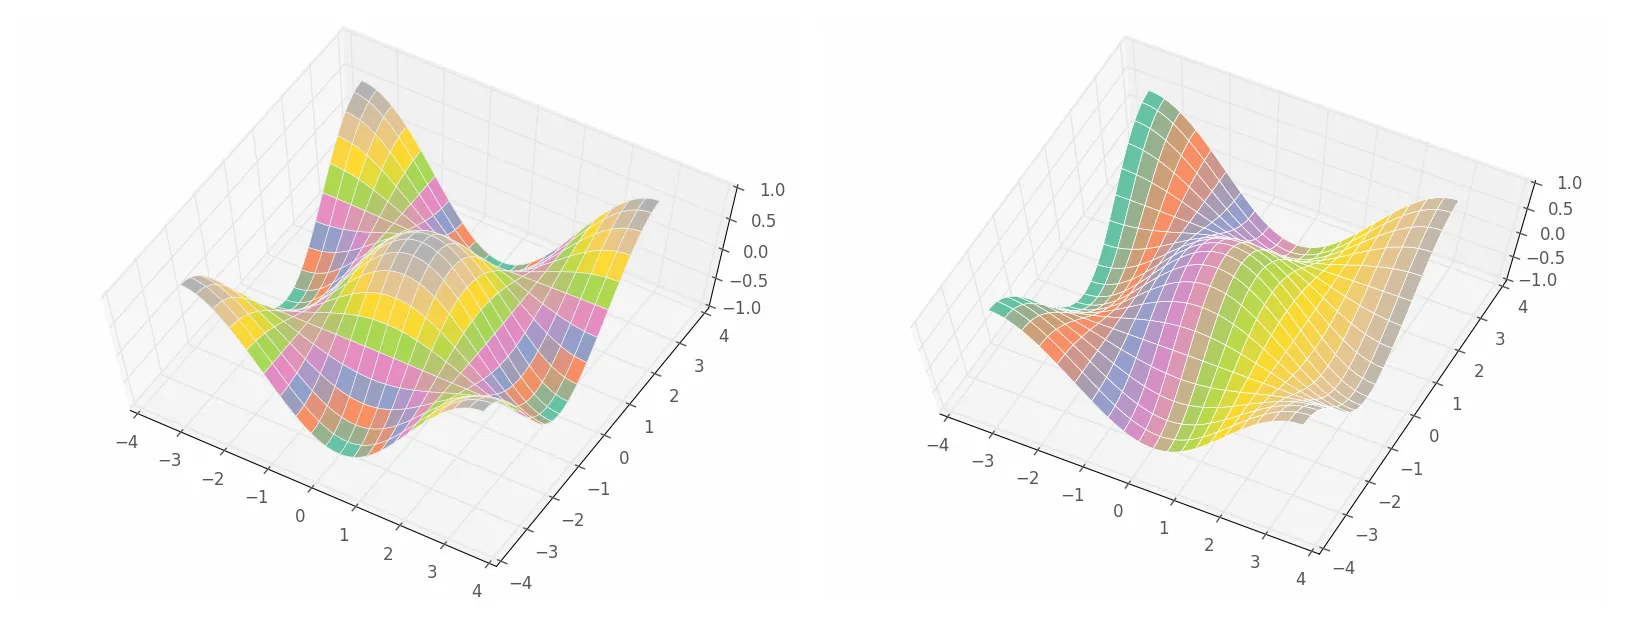
Final figure

1个回答

4

您可以尝试以下方法:

import matplotlib.pyplot as plt
from mpl_toolkits.mplot3d import Axes3D
import numpy as np

X = np.linspace(-np.pi, np.pi, 200, endpoint=True)
Y = np.linspace(-np.pi, np.pi, 200, endpoint=True)
XX, YY = np.meshgrid(X,Y)
Z = np.cos(XX)*np.cos(YY)

fig = plt.figure()
ax1 = plt.subplot2grid((1,2), (0,0), projection='3d')
ax2 = plt.subplot2grid((1,2), (0,1), projection='3d')
surf = ax1.plot_surface(XX, YY, Z,
                        cmap=plt.cm.Set2)
surf2 = ax2.plot_surface(XX, YY, Z, shade=False,
                         facecolors=plt.cm.Set2((XX-XX.min())/(XX.max()-XX.min()))
                         )

对于第二个图,你需要将facecolors设置为XX的函数,而不是默认的Z。你需要将XX的值重新缩放在0和1之间,否则colormap将在0和1之外饱和。当使用cmap(在第一个图中)时,还需要移除阴影。

然而,由于某些未知原因,线条消失了。

你可以通过以下方式重新添加它们:

plt.draw() # you need this to get the edge color
lines = np.array(surf2.get_edgecolor())
surf2.set_edgecolor(lines*np.array([0,0,0,0])+1) # make lines white, and keep alpha==1. It's an array of colors like this: [r,g,b,alpha]

它提供了: cmap3d 希望有所帮助。

网页内容由stack overflow 提供, 点击上面的
可以查看英文原文,
原文链接