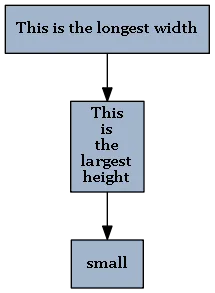
我正在尝试配置我的Digraph调用,使得每个节点使用所需的最大宽度和高度。如下图所示,每个节点的宽度将与第一个节点相同,而高度将与第二个节点相同。我已经查看了fixedsize属性,但似乎不太适合。如果将fixedsize设置为true,则必须指定限制条件。如果可能的话,我宁愿自动确定这一点。所需的最大值取决于给定图的节点标签,并且不总是相同的。
fixedsize: 如果为false,则节点的大小由其标签和图像(如果有)所需的最小宽度和高度以及由margin属性指定的边距确定。宽度和高度必须至少与width和height属性指定的大小一样大,这些属性指定了这些参数的最小值。 如果为true,则节点大小仅由width和height属性的值指定,并且不会扩展到包含文本标签。如果标签(带有margin)无法适合这些限制,则会发出警告。 如果将fixedsize属性设置为shape,则width和height属性还确定节点形状的大小,但标签可以更大。在避免节点重叠时,使用标签和形状大小,但所有到节点的边都忽略标签,只接触节点形状。如果标签太大,则不会发出警告。
示例设置:
dot = Digraph(comment="Example 1",
          format='png',
          edge_attr={'color':'black',
                     'style':'filled'},
          graph_attr={'fixedsize':'false',
                      'bgcolor':'transparent'},
          node_attr={'fontname':'bold',
                     'fontsize':'11',
                     'shape':'sqaure',
                     'color':'black',
                     'style':'filled',
                     'fillcolor':'lightsteelblue3'})
fixedsize: 如果为false,则节点的大小由其标签和图像(如果有)所需的最小宽度和高度以及由margin属性指定的边距确定。宽度和高度必须至少与width和height属性指定的大小一样大,这些属性指定了这些参数的最小值。 如果为true,则节点大小仅由width和height属性的值指定,并且不会扩展到包含文本标签。如果标签(带有margin)无法适合这些限制,则会发出警告。 如果将fixedsize属性设置为shape,则width和height属性还确定节点形状的大小,但标签可以更大。在避免节点重叠时,使用标签和形状大小,但所有到节点的边都忽略标签,只接触节点形状。如果标签太大,则不会发出警告。
from graphviz import Digraph

dot = Digraph(comment="Example 1",
              format='gv',
              edge_attr={'color':'brown',
                         'style':'filled'},
              graph_attr={'rankdir':'LR',
                          'bgcolor':'transparent'},
              node_attr={'fontsize':'11',
                         'shape':'sqaure',
                         'color':'black',
                        'style':'filled',
                        'fillcolor':'antiquewhite'})
# nodes and edges
dot.node('1', 'This is the longest width')
dot.node('2', 'This\nis\nthe\nlargest\nheight')
dot.node('3', 'Small')
dot.edges(['12','23'])

def get_node_max(digraph):
    import re
    heights = [height.split('=')[1] for height in re.findall('height=[0-9.]+', str(digraph))]
    widths = [width.split('=')[1] for width in re.findall('width=[0-9.]+', str(digraph))]
    heights.sort(key=float)
    widths.sort(key=float)
    return heights[len(heights)-1], widths[len(widths)-1]

params = {'format':'png', 'fixedsize':'false', 'width':'1', 'height':'1'}

params['height'], params['width'] = get_node_max(dot.pipe())


dot = Digraph(comment="Example 1",
              format=params['format'],
              edge_attr={'color':'brown',
                         'style':'filled'},
              graph_attr={'rankdir':'LR',
                          'bgcolor':'transparent'},
              node_attr={'fixedsize':params['fixedsize'],
                         'width':params['width'],
                         'height':params['height'],
                         'fontsize':'11',
                         'shape':'sqaure',
                         'color':'black',
                        'style':'filled',
                        'fillcolor':'antiquewhite'})
# nodes and edges
dot.node('1', 'This is the longest width')
dot.node('2', 'This\nis\nthe\nlargest\nheight')
dot.node('3', 'Small')
dot.edges(['12','23'])

dot.render('example-graphviz.gv', view=True)