我正在尝试在Graphviz中创建一个包含节点和边的图例/键。虽然我已经阅读了这篇文章,但HTML表格似乎无法实现我想要的效果。
现在,我正在使用以下代码:
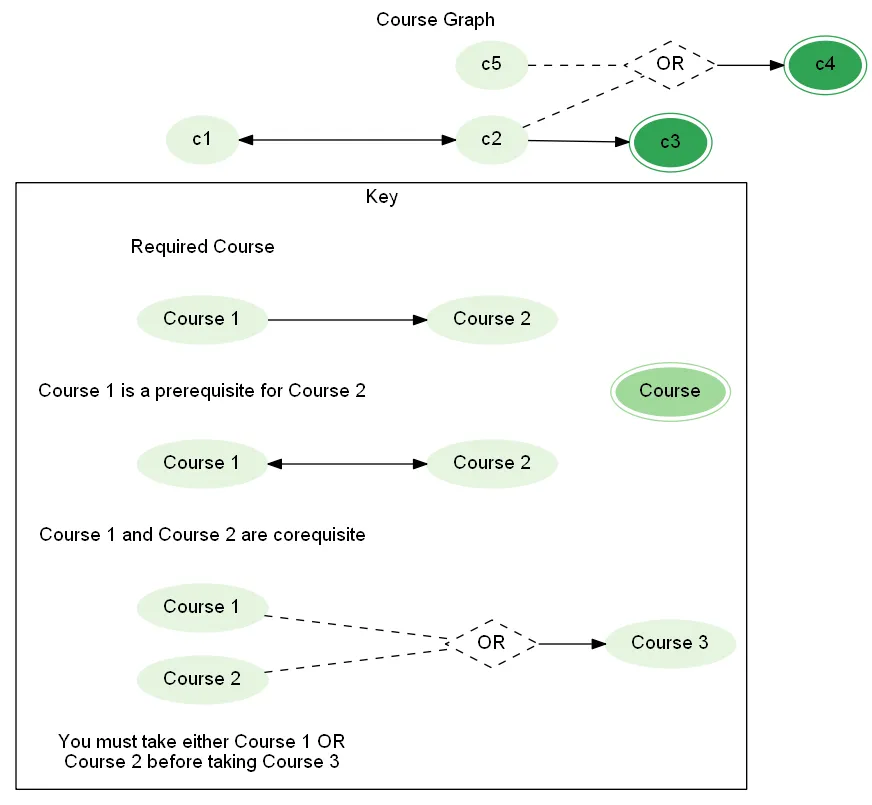
这段代码的结果是:
现在,我正在使用以下代码:
digraph G {
fontname="Helvetica";
labelloc=t;
rankdir=LR;
label="Course Graph";

node[style=filled, fontname="Helvetica", colorscheme=greens3, color=1];

subgraph cluster_key {
    rank=min;

    label="Key";
    rankdir=LR;

    kc1[label="Course", peripheries=2, color=2];
    k1[shape=plaintext, style=solid, label="Required Course"]
    prereq[label="Course 1"];
    kc2[label="Course 2"];
    prereq->kc2;
    k2[shape=plaintext, style=solid, label="Course 1 is a prerequisite for Course 2"]
    coreq1[label="Course 1"];
    coreq2[label="Course 2"];
    coreq1->coreq2[dir=both];
    k3[shape=plaintext, style=solid, label="Course 1 and Course 2 are corequisite"]

    or[style="dashed", color="black", shape="diamond", label="OR"];
    or1[label="Course 1"];
    or1 -> or[style="dashed", dir="none"];
    or2[label="Course 2"];
    or2 -> or[style="dashed", dir="none"];
    kc3[label="Course 3"]
    or->kc3;
    k4[shape=plaintext, style=solid, label="You must take either Course 1 OR\nCourse 2 before taking Course 3"]
    { rank=min;k1 k2 k3 k4 }
}

c3[color=3, peripheries=2];
c4[color=3, peripheries=2];

c1->c2[dir=both];
c2->c3;

c4_reqs[style="dashed", color="black", shape="diamond", label="OR"];
c4_reqs->c4;
c2->c4_reqs[style="dashed", dir="none"];
c5->c4_reqs[style="dashed", dir="none"];

}
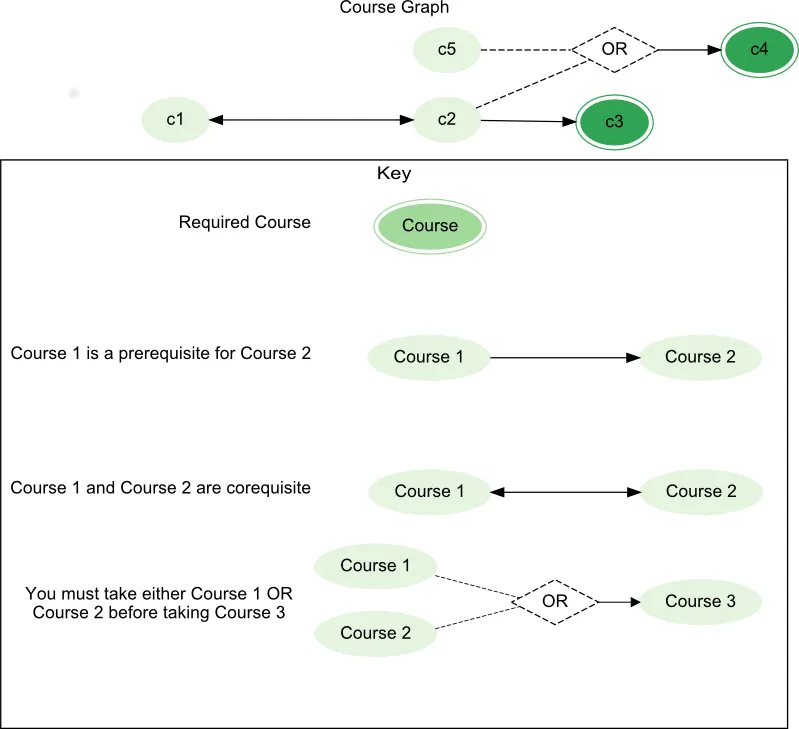
这段代码的结果是:
 }}
}}