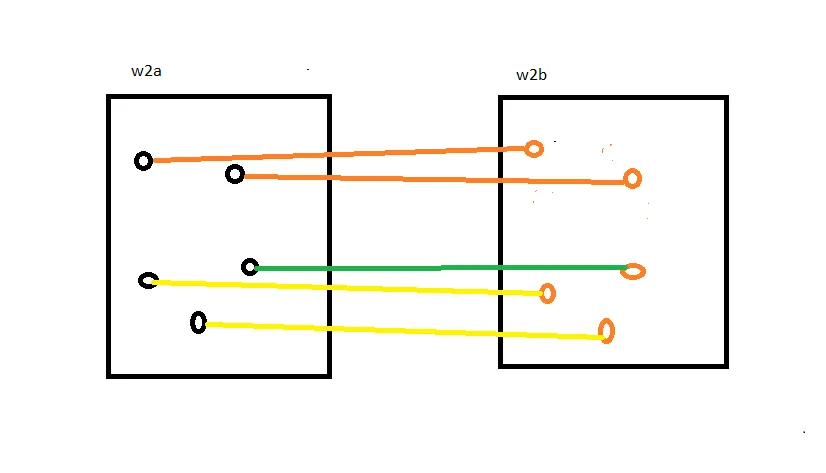
我有两张图片,分别是图1和图2。它们都来自同一来源,但没有对齐。任务是在这两个图像中找到共同的数据点,并在匹配的数据点之间绘制线条。我希望最终的结果看起来像图4。
目前为止,我使用了OpenCV并编写了以下代码:
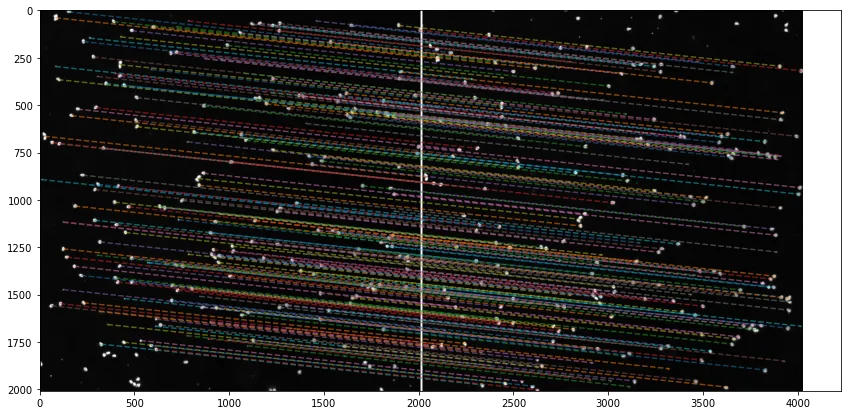
这个结果出乎意料,见图4。此外,它看起来相当混乱和不清晰。 有人能帮我解决这个问题吗?提前谢谢。 图1。
目前为止,我使用了OpenCV并编写了以下代码:
import cv2
import matplotlib.pyplot as plt

img_file1= "Fig_1.png"
img_file2= "Fig_2.png"
img1= cv2.imread(img_file1)
img2= cv2.imread(img_file2)

img1 = cv2.cvtColor(img1, cv2.COLOR_BGR2GRAY)
img2 = cv2.cvtColor(img2, cv2.COLOR_BGR2GRAY)

figure, ax = plt.subplots(1, 2, figsize=(16, 8))

ax[0].imshow(img1, cmap='gray')
ax[1].imshow(img2, cmap='gray')

#sift
sift = cv2.xfeatures2d.SIFT_create()

keypoints_1, descriptors_1 = sift.detectAndCompute(img1,None)
keypoints_2, descriptors_2 = sift.detectAndCompute(img2,None)

#feature matching
bf = cv2.BFMatcher(cv2.NORM_L1, crossCheck=True)

matches = bf.match(descriptors_1,descriptors_2)
matches = sorted(matches, key = lambda x:x.distance)

img3 = cv2.drawMatches(img1, keypoints_1, img2, keypoints_2, matches[:50], img2, flags=2)
plt.imshow(img3),plt.show()
这个结果出乎意料,见图4。此外,它看起来相当混乱和不清晰。 有人能帮我解决这个问题吗?提前谢谢。 图1。
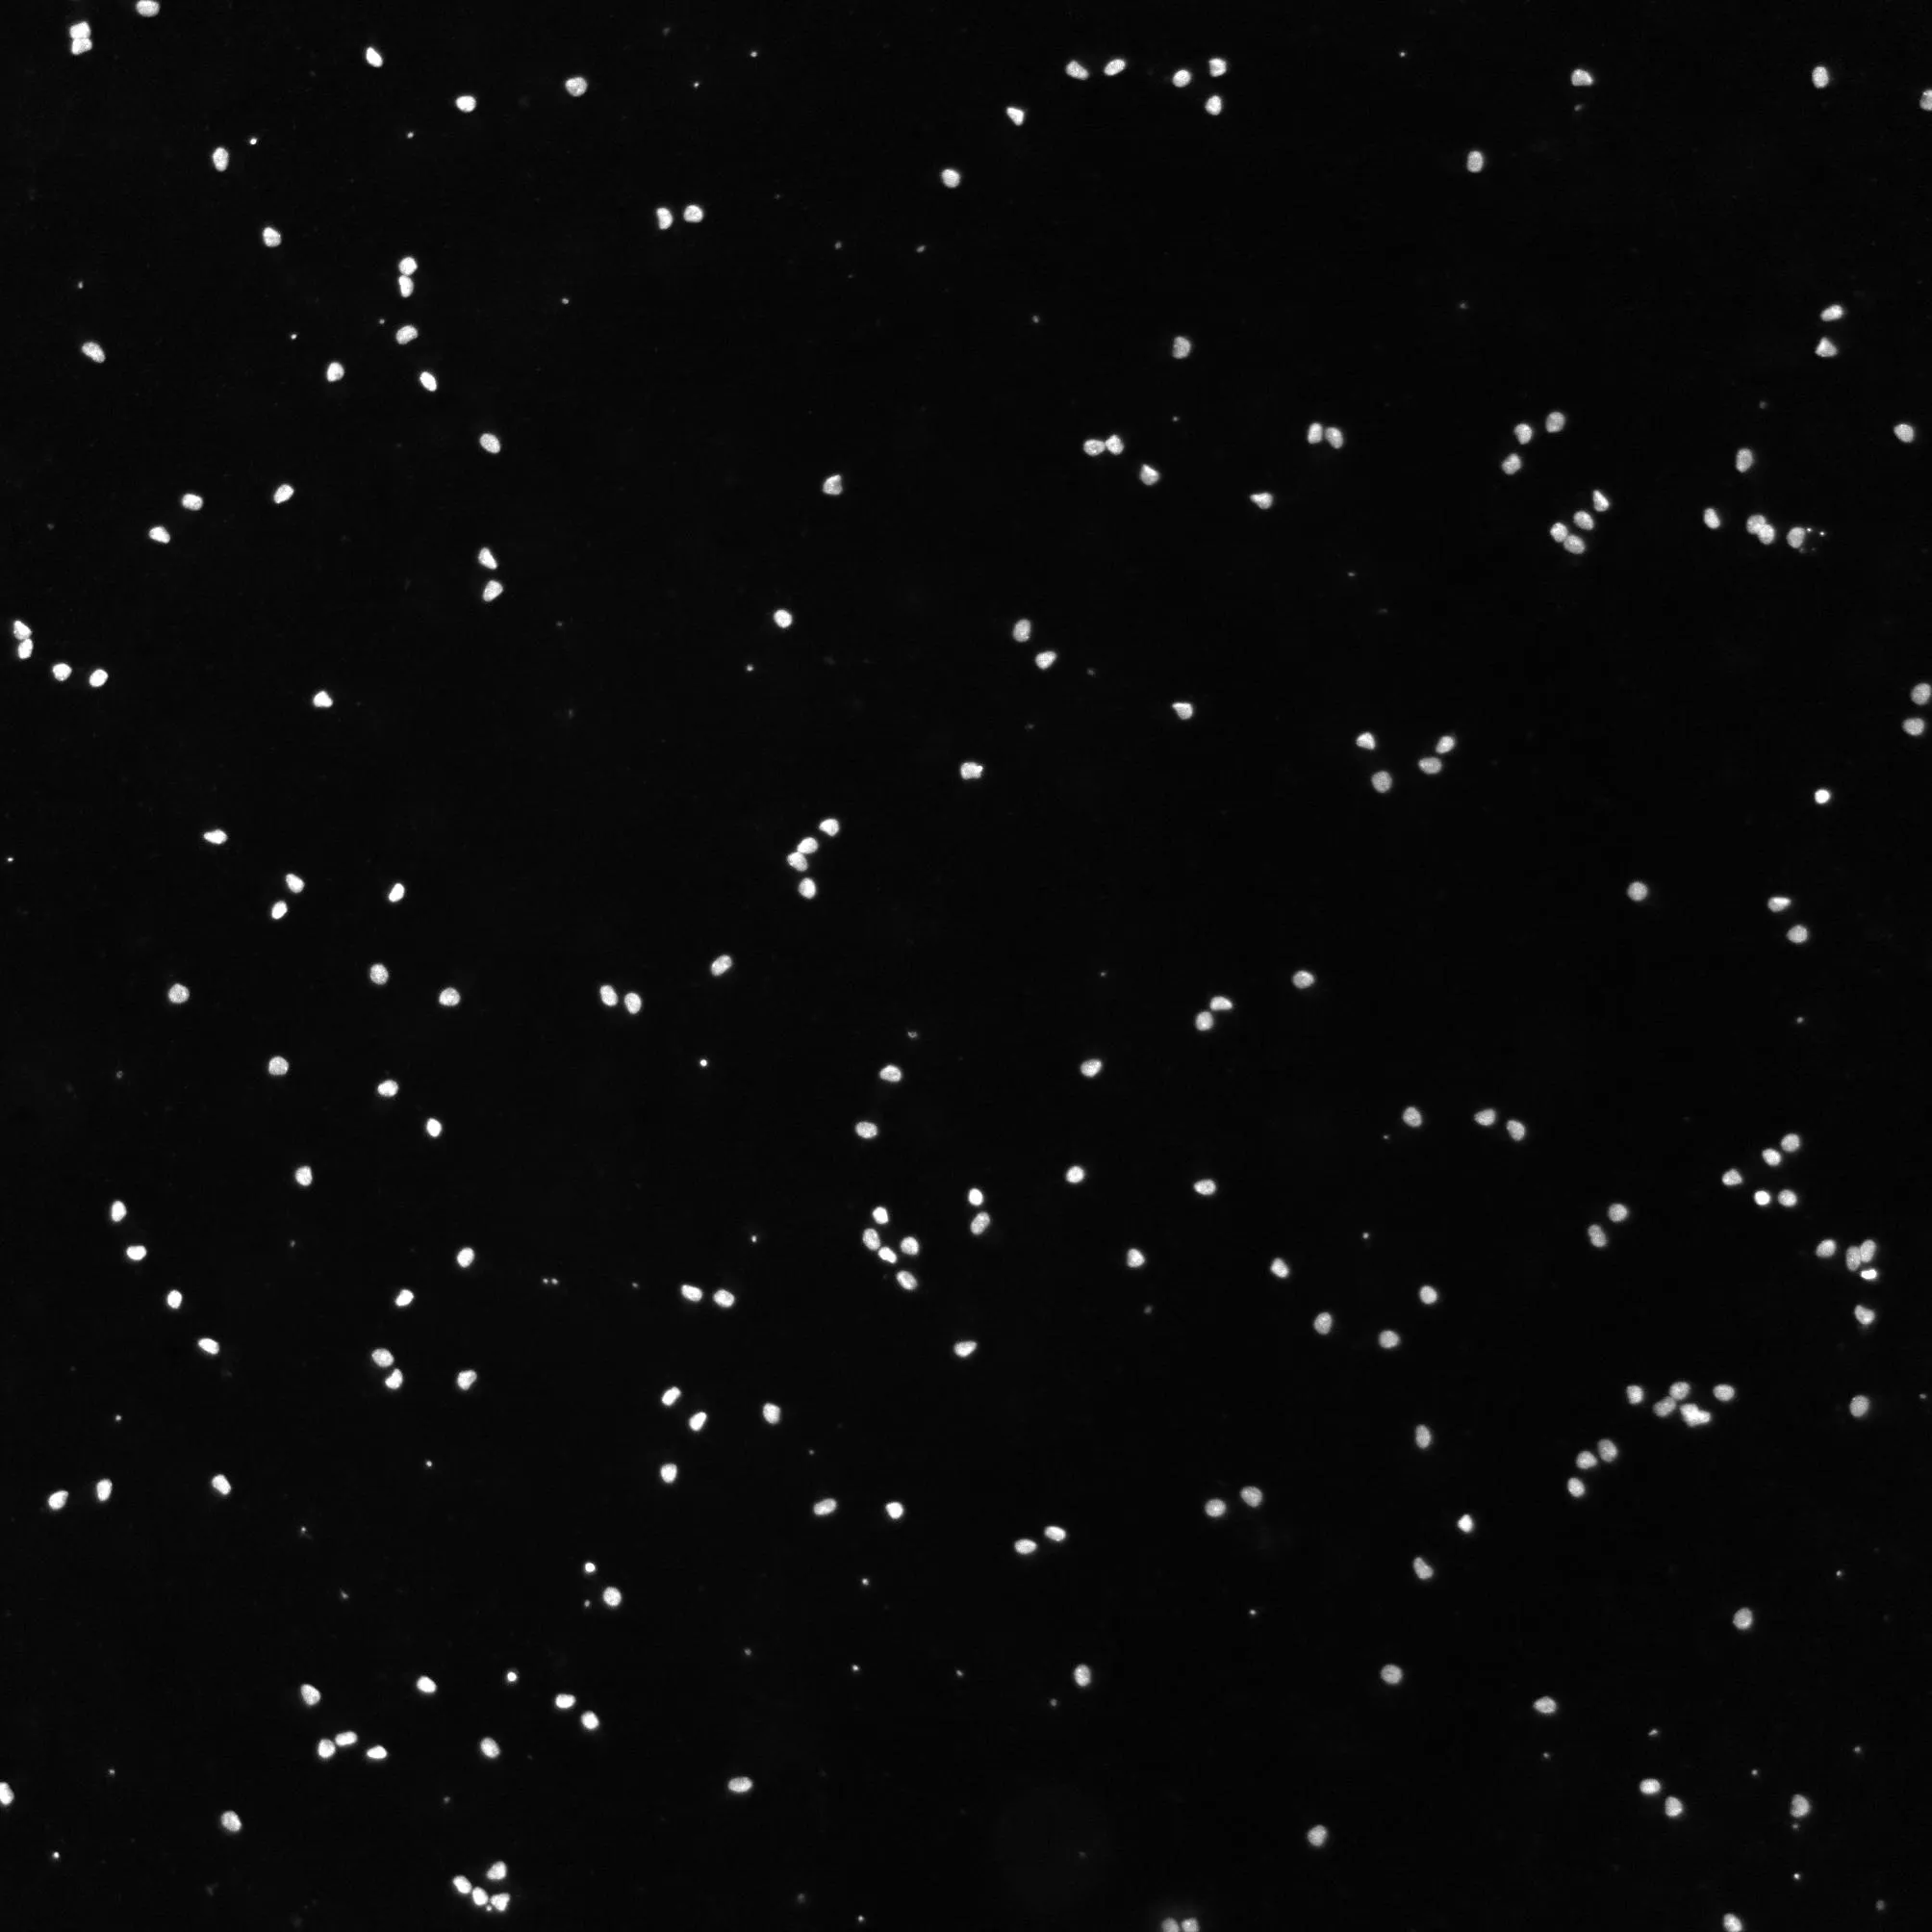
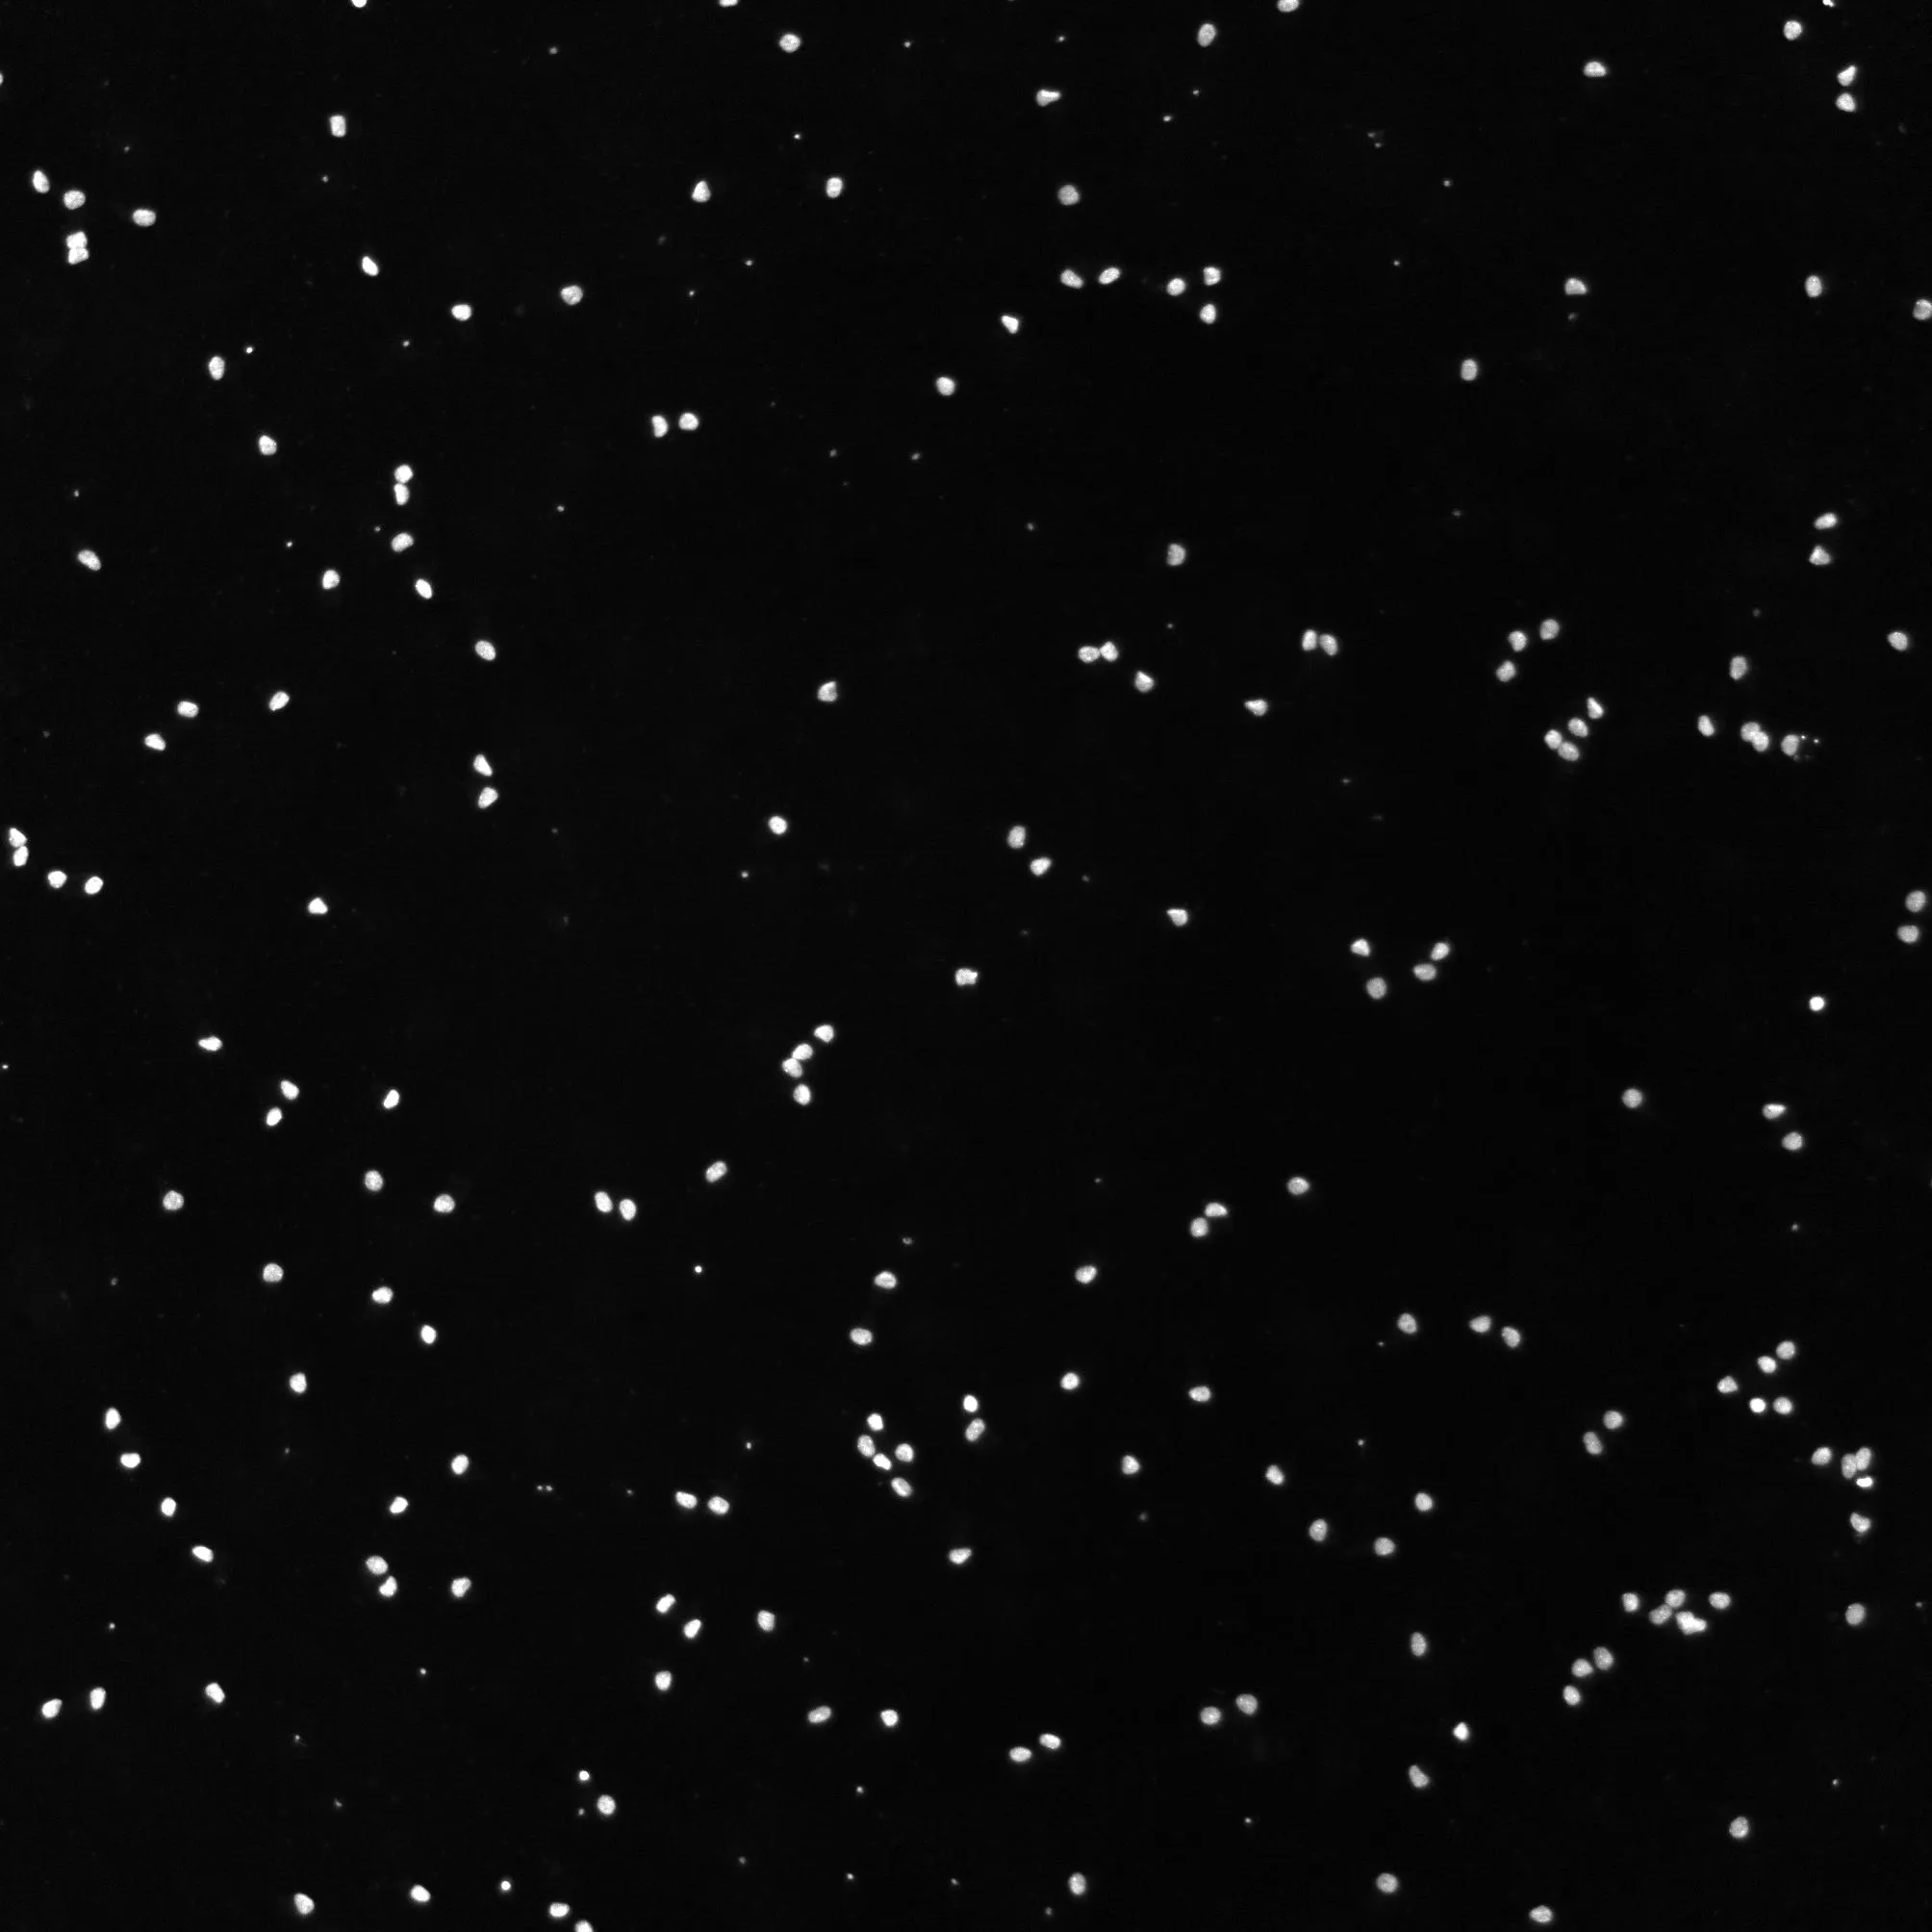
图2
img3
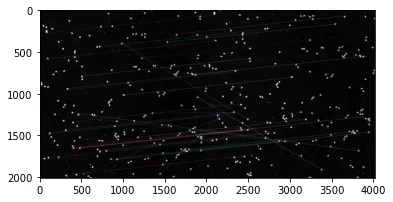
图3