我想使用Matplotlib在等高线图上绘制一些点。
我有一个标量场,想要在上面绘制等高线。 但是我的ndarray的维度是0 x 20,而我的实际空间变化范围从-4到4。
我可以使用以下代码来绘制等高线:
x, y = numpy.mgrid[-4:4:20*1j, -4:4:20*1j]

# Draw the scalar field level curves
cs = plt.contour(scalar_field, extent=[-4, 4, -4, 4])
plt.clabel(cs, inline=1, fontsize=10)
问题是我需要在这个图中绘制一些点,而这些点是使用ndarray获得的,即,我获取随着该数组维度变化而变化的点。我尝试使用以下代码绘制这些点:
def plot_singularities(x_dim, y_dim, steps, scalar_field, min_points, max_points, file_path):
    """
    :param x_dim : the x dimension of the scalar field
    :param y_dim : the y dimension of the scalar field
    :param steps : the discretization of the scalar field
    :param file_path : the path to save the data
    :param scalar_field : the scalar_field to be plot
    :param min_points : a set (x, y) of min points of the scalar field
    :param max_points : a set (x, y) of max points of the scalar field
    """
    min_points_x = min_points[0]
    min_points_y = min_points[1]
    max_points_x = max_points[0]
    max_points_y = max_points[1]

    plt.figure()

    x, y = numpy.mgrid[-x_dim:x_dim:steps*1j, -y_dim:y_dim:steps*1j]

    # Draw the scalar field level curves
    cs = plt.contour(scalar_field, extent=[-x_dim, x_dim, -y_dim, y_dim])
    plt.clabel(cs, inline=1, fontsize=10)

    # Draw the min points
    plt.plot(min_points_x, min_points_y, 'ro')

    # Draw the max points
    plt.plot(max_points_x, max_points_y, 'bo')

    plt.savefig(file_path + '.png', dpi=100)
    plt.close()
但是我得到了这个图片:
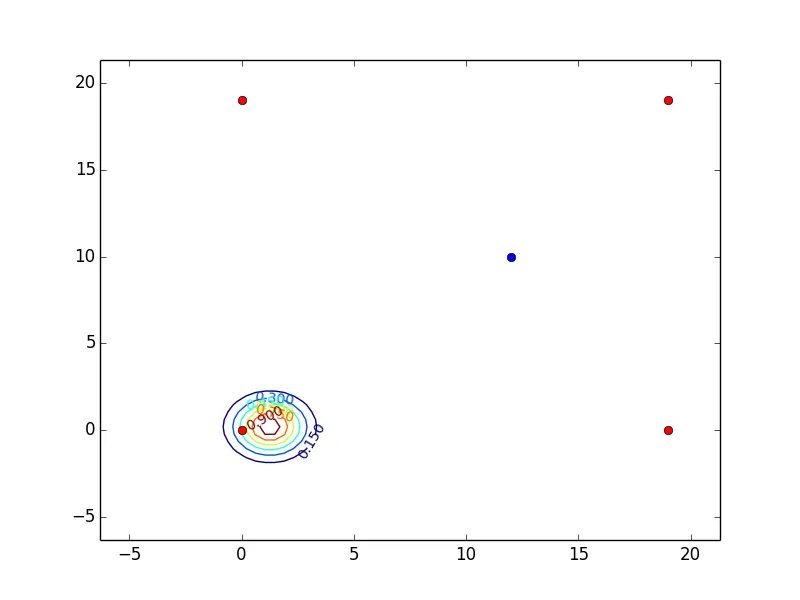
这张图片是不正确的。
如果我改变这一行:
cs = plt.contour(scalar_field, extent=[-x_dim, x_dim, -y_dim, y_dim])
对于这个问题:
cs = plt.contour(scalar_field)
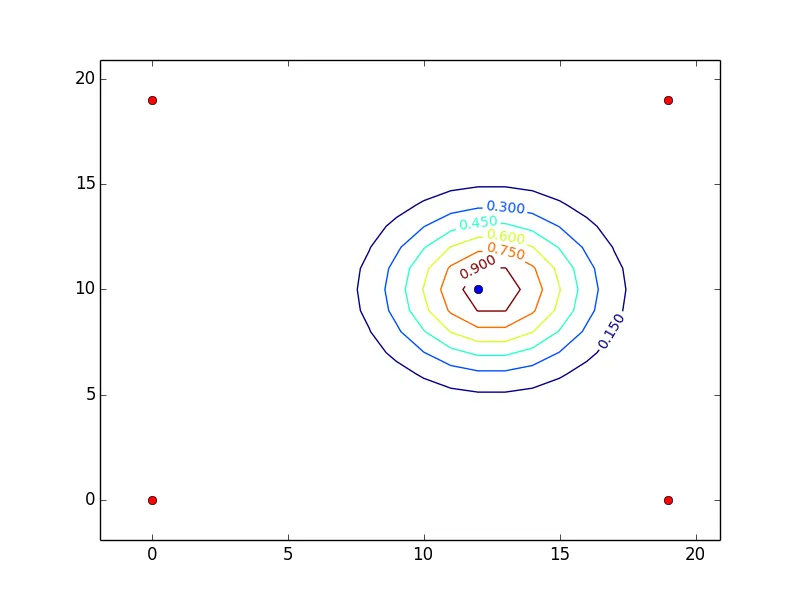
我得到了期望的结果,但是范围没有显示出我的真实数据空间,而是ndarray的维度。
最后,如果我不绘制这些点(注释掉plot()行),我可以得到想要的范围:
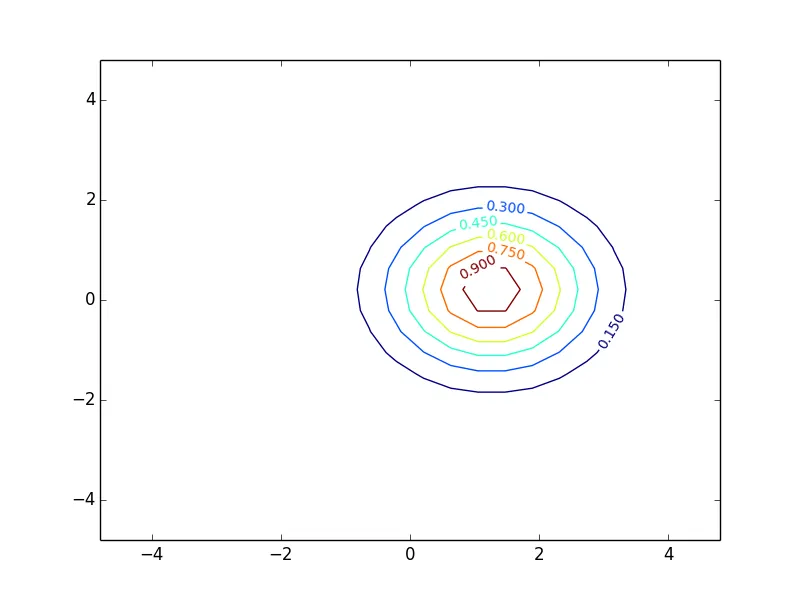
但我必须绘制这些点。 两个数据都在相同的空间中。 但是contour()函数允许我指定网格。 我找到了一种方法来在绘制点时完成这个操作。
如何正确地设置范围?