在Cartopy GeoAxes上绘制一个rasterio栅格图像

3

我看到了一些关于这个主题的问题,但是库已经发生了足够的变化,以至于那些答案似乎不再适用。

Rasterio 曾经包括一个示例 用于在Cartopy GeoAxes上绘制rasterio栅格。该示例大致如下:

import matplotlib.pyplot as plt
import rasterio
from rasterio import plot

import cartopy
import cartopy.crs as ccrs

world = rasterio.open(r"../tests/data/world.rgb.tif")

fig = plt.figure(figsize=(20, 12))
ax = plt.axes(projection=ccrs.InterruptedGoodeHomolosine())
ax.set_global()
plot.show(world, origin='upper', transform=ccrs.PlateCarree(), interpolation=None, ax=ax)

ax.coastlines()
ax.add_feature(cartopy.feature.BORDERS)

然而,这段代码不再绘制光栅图。相反,我会得到类似于这样的东西:

map without raster (incorrect output)

它应该看起来像这样:

map with raster (old, correct output)

当我在rasterio问题跟踪器中询问此事时,他们告诉我示例已过时(并删除了示例)。不过,我想知道是否有办法实现我想做的事情。是否有人能指点一下我?

2个回答

3

我认为你可能想将数据读取到一个 numpy.ndarray 中,并使用 ax.imshow 进行绘制,其中 ax 是你的 cartopy.GeoAxes(就像你已经有的那样)。我提供了下面的示例来说明我的意思。

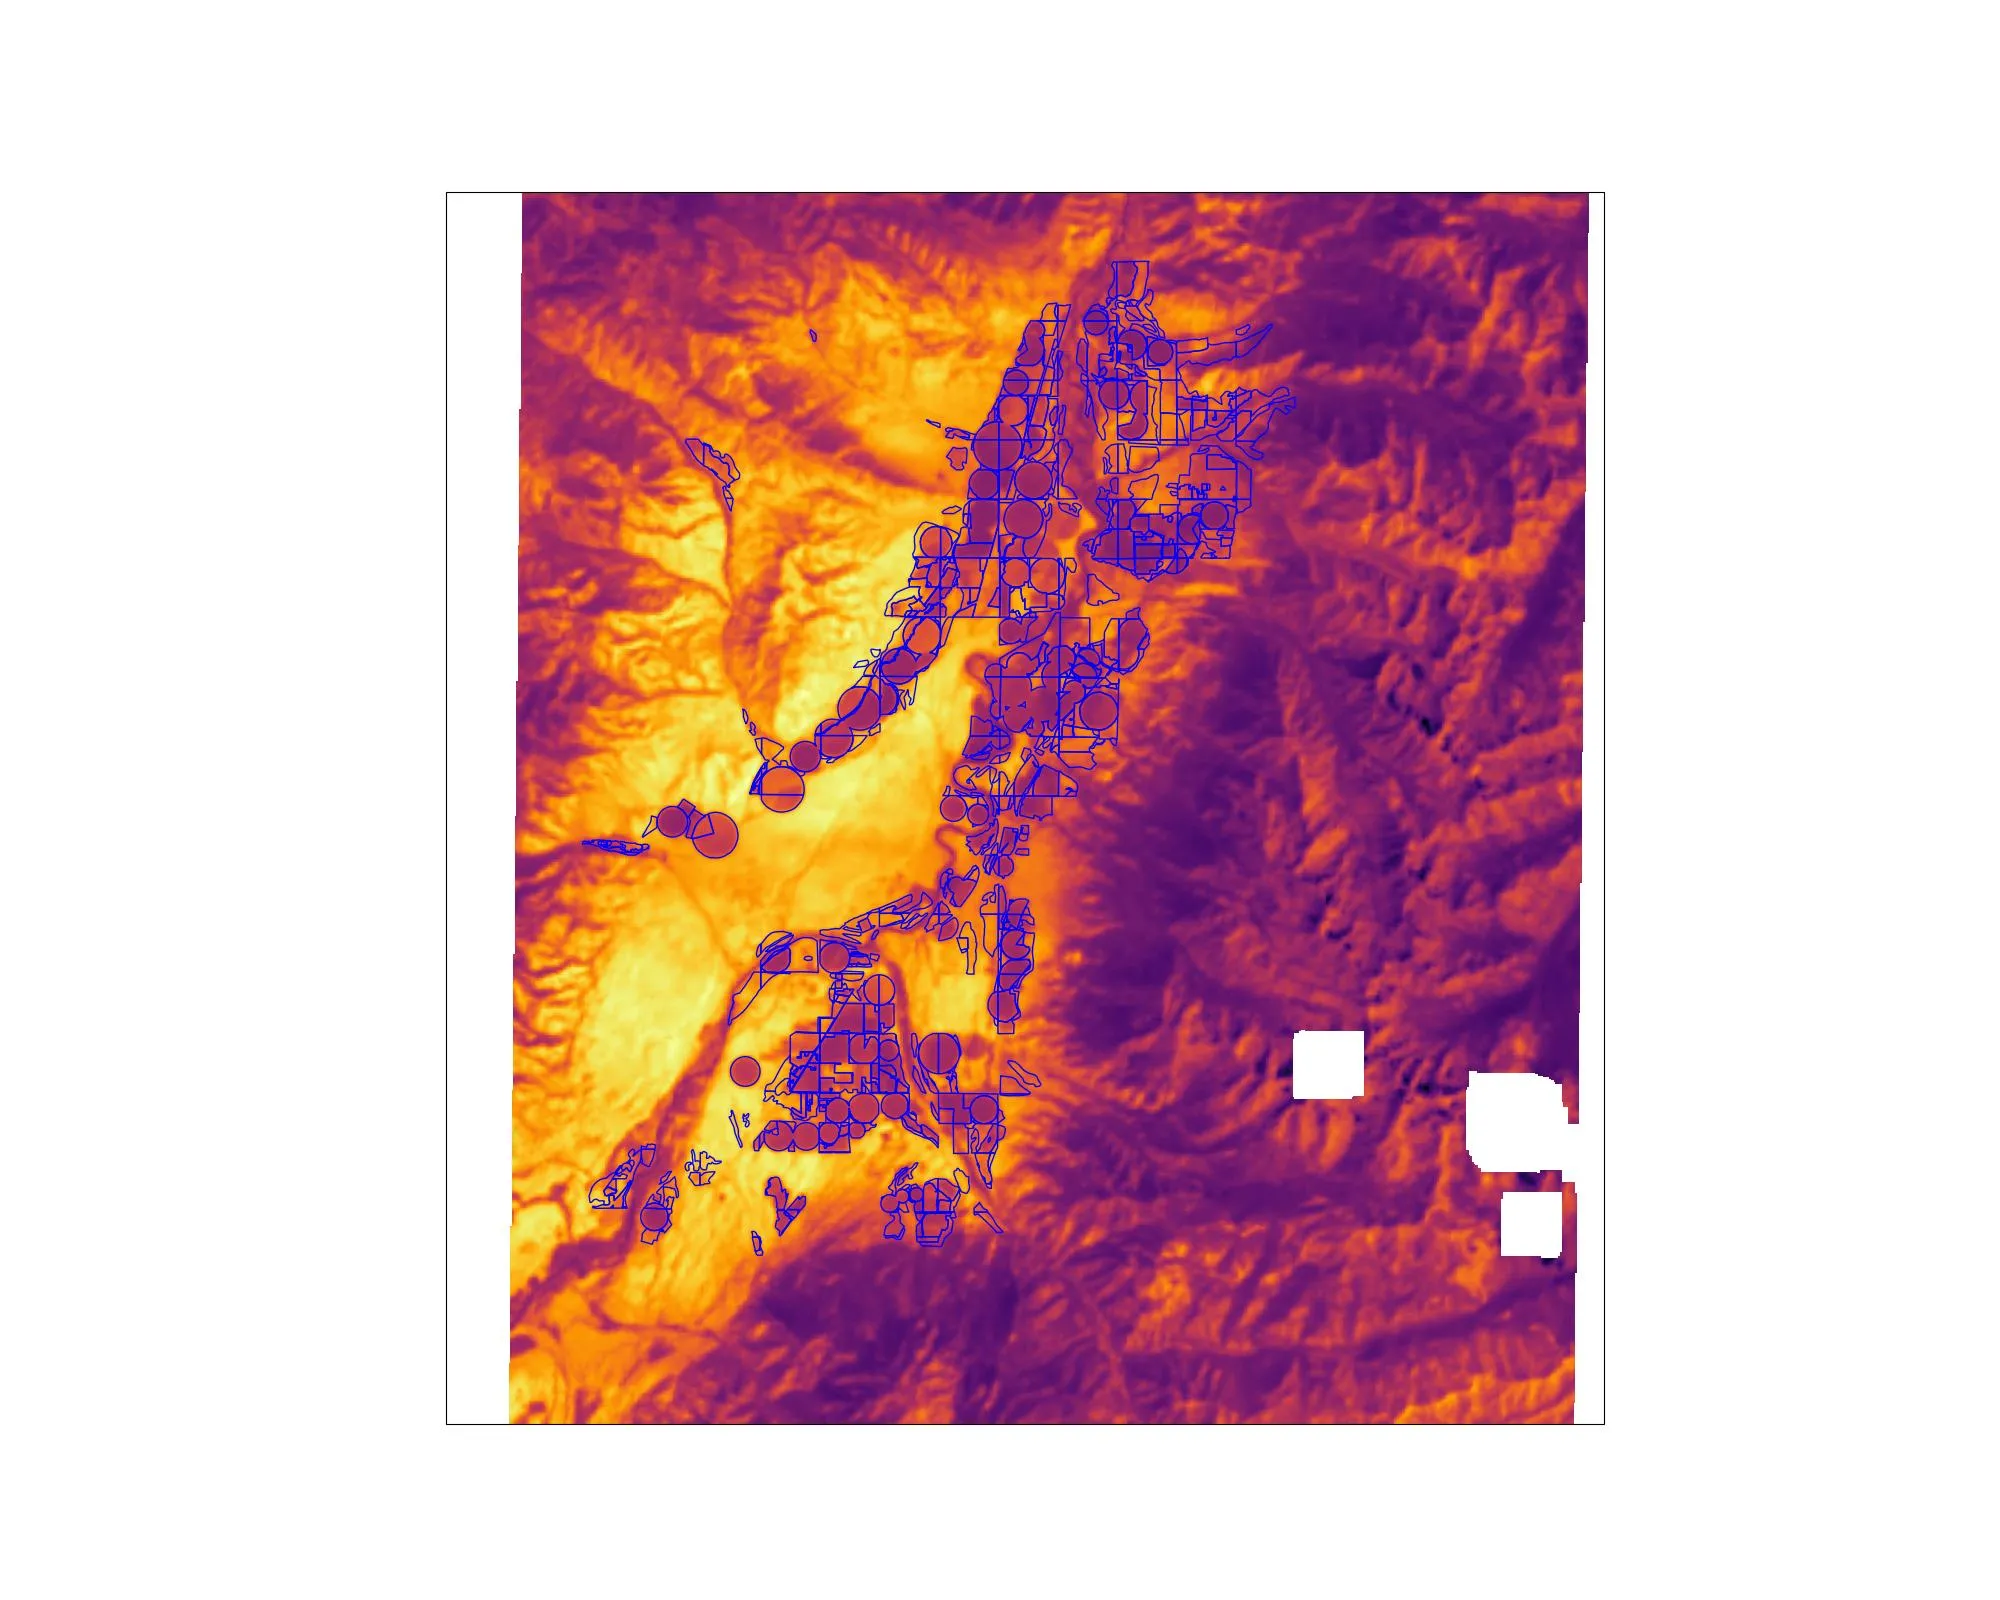
我为这个示例截取了一小块Landsat地表温度和一些农田。获取它们的方法在此驱动器链接.

请注意,农田数据是WGS 84(epsg 4326),Landsat图像是UTM Zone 12(epsg 32612),而我希望我的地图是 Lambert Conformal Conic 坐标系。Cartopy使得这很容易实现。

import numpy as np
import cartopy.crs as ccrs
from cartopy.io.shapereader import Reader
from cartopy.feature import ShapelyFeature
import rasterio
import matplotlib.pyplot as plt


def cartopy_example(raster, shapefile):
    with rasterio.open(raster, 'r') as src:
        raster_crs = src.crs
        left, bottom, right, top = src.bounds
        landsat = src.read()[0, :, :]
        landsat = np.ma.masked_where(landsat <= 0,
                                     landsat,
                                     copy=True)
        landsat = (landsat - np.min(landsat)) / (np.max(landsat) - np.min(landsat))

    proj = ccrs.LambertConformal(central_latitude=40,
                                 central_longitude=-110)

    fig = plt.figure(figsize=(20, 16))
    ax = plt.axes(projection=proj)
    ax.set_extent([-110.8, -110.4, 45.3, 45.6], crs=ccrs.PlateCarree())

    shape_feature = ShapelyFeature(Reader(shapefile).geometries(),
                                   ccrs.PlateCarree(), edgecolor='blue')
    ax.add_feature(shape_feature, facecolor='none')
    ax.imshow(landsat, transform=ccrs.UTM(raster_crs['zone']),
              cmap='inferno',
              extent=(left, right, bottom, top))
    plt.savefig('surface_temp.png')


feature_source = 'fields.shp'
raster_source = 'surface_temperature_32612.tif'

cartopy_example(raster_source, feature_source)

使用Cartopy的关键是记住为您的轴对象使用projection关键字,因为这会将地图呈现为您选择的漂亮投影(在我的情况下为LCC)。 使用transform关键字来指示您的数据所在的投影系统,以便Cartopy知道如何呈现它。 陆地表面温度

这是一个很好的解决方案!您是否知道是否有一种方法,使光栅仍然显示,即使对于cartopy矢量特征的facecolor ='white'或其他颜色?我发现cartopy特征绘制在顶部。 - user308827
1
这个方法很有效,但我不得不将raster_crs['zone']更改为12,即UTM区域号,才能使其正常工作。是否有一些变化导致raster_crs['zone']不再起作用?我们还有其他方法可以获取区域号吗? - Casivio

-1

不需要使用rasterio。获取一个蓝色大理石图像,然后绘制它。

这是可行的代码:

import cartopy
import matplotlib.pyplot as plt
import cartopy.crs as ccrs

fig = plt.figure(figsize=(10, 5))
ax = plt.axes(projection=ccrs.InterruptedGoodeHomolosine())
# source of the image:
# https://eoimages.gsfc.nasa.gov/images/imagerecords/73000/73909/world.topo.bathy.200412.3x5400x2700.jpg
fname = "./world.topo.bathy.200412.3x5400x2700.jpg"
img_origin = 'lower'
img = plt.imread(fname)
img = img[::-1]
ax.imshow(img, origin=img_origin, transform=ccrs.PlateCarree(), extent=[-180, 180, -90, 90])

ax.coastlines()
ax.add_feature(cartopy.feature.BORDERS)

ax.set_global()
plt.show()

输出的图表:

interrupted_projection


是的,但我需要它能够处理月球极高分辨率的地形数据(以及笔记本中的地球示例),而你的解决方案无法胜任。我不是因为喜欢剪切和粘贴代码才决定使用rasterio的。 :) - Translunar
@DoctorMohawk,您没有提到所需的分辨率,而且月亮可能是++。我会等待并查看被接受的答案。 - swatchai
虽然你说得没错,我确实没有提到所需的分辨率,但我确实特别说明了我想在Cartopy GeoAxes上呈现一个rasterio栅格。 - Translunar
“我在想是否有一种方法可以做我想做的事情…” - swatchai

网页内容由stack overflow 提供, 点击上面的
可以查看英文原文,
原文链接