我画了两组重叠的坐标轴,其中一组是另一组的缩小版。我想在缩小的坐标轴的角落和它在较大坐标轴上所表示的矩形的角落之间画线。然而,我画出来的线有些偏移。我尝试将其简化为一个简单的例子:
以下是输出结果: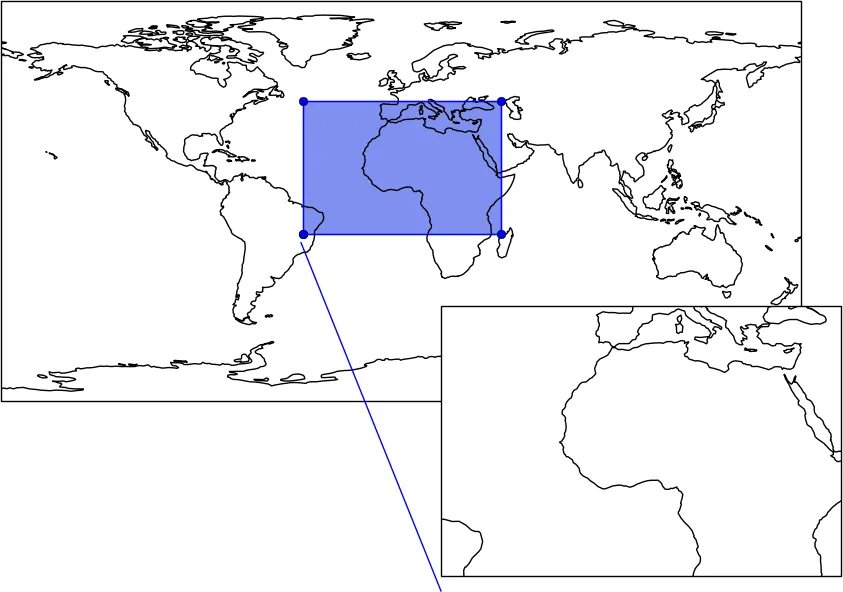 我认为这是因为在调用
import cartopy.crs as ccrs
import matplotlib.pyplot as plt


# Create a large figure:
fig = plt.figure(figsize=(10, 10))

# Add an axes set and draw coastlines:
ax1 = plt.axes([0.01, 0.49, 0.8, 0.5], projection=ccrs.PlateCarree())
ax1.set_global()
ax1.coastlines()

# Add a second axes set (overlaps first) and draw coastlines:
ax2 = plt.axes([0.45, 0.35, 0.4, 0.3], projection=ccrs.PlateCarree())
ax2.set_extent([-44, 45, -15, 45], crs=ccrs.PlateCarree())
ax2.coastlines()

# Draw the rectangular extent of the second plot on the first:
x = [-44, 45, 45, -44, -44]
y = [-15, -15, 45, 45, -15]
ax1.fill(x, y, transform=ccrs.PlateCarree(), color='#0323E4', alpha=0.5)
ax1.plot(x, y, transform=ccrs.PlateCarree(), marker='o')

# Now try and draw a line from the bottom left corner of the second axes set
# to the bottom left corner of the extent rectangle in the first plot:
transFigure = fig.transFigure.inverted()
coord1 = transFigure.transform(ax2.transAxes.transform([0, 0]))
coord2 = transFigure.transform(ax1.transData.transform([-45, -15]))
line = plt.Line2D((coord1[0], coord2[0]), (coord1[1], coord2[1]), transform=fig.transFigure)
fig.lines.append(line)

plt.show()
以下是输出结果:
我认为这是因为在调用plt.axes()时,我明确定义了轴的形状/纵横比,而这种形状与cartopy轴的绘制形状不匹配,因为后者的纵横比被设计成能够使地图看起来正确。我可以调整我对plt.axes()的调用中轴的形状,使其纵横比与地图相匹配,并且线条会被画在我期望的位置上,但这不容易做到!有没有一种方法可以通过坐标变换解决这个问题?