我已经能够使用matplotlib绘制和显示我的栅格图像。那部分是成功的。我卡在的部分是如何保存这个图形。对于rasterio,我找到了两个有用的教程:
https://rasterio.readthedocs.io/en/latest/topics/windowed-rw.html
并且
我已经得到了一个名为NDVI的函数的计算结果,通过matplotlib可以使用以下代码将其以我想要的方式显示出来。但是当我尝试将文件保存为GeoTIFF时,在桌面上的图像都是黑色的。我计划对数据进行投影转换,并将该代码注释掉。
这是我的代码:
import rasterio
import matplotlib.pyplot as plt
import numpy as np


nirband = r"LC08_L1TP_015033_20170822_20170912_01_T1_B5.TIF"

redband =r"LC08_L1TP_015033_20170822_20170912_01_T1_B4.TIF"


#rasterio.windows.Window(col_off, row_off, width, height)
window = rasterio.windows.Window(2000,2000,800,600)

with rasterio.open(nirband) as src:
    subset = src.read(1, window=window)

fig, ax = plt.subplots(figsize=(12,6))
plt.imshow(subset)
plt.title(f'Band 5 Subset')


with rasterio.open(nirband) as src:
    nir = src.read(1, window=window)

with rasterio.open(redband) as src:
    red = src.read(1, window=window)

red = red.astype(float)
nir = nir.astype(float)
np.seterr(divide='ignore', invalid='ignore')

ndvi = np.empty(nir.shape, dtype=rasterio.float32)
check = np.logical_or ( red > 0, nir > 0 )
naip_ndvi = np.where ( check,  (1.0*(nir - red )) / (1.0*( nir + red )),-2 )


fig, ax = plt.subplots(figsize=(12,6))
ndvi = ax.imshow(naip_ndvi)
ax.set(title="NDVI")


with rasterio.open("LC08_L1TP_015033_20170822_20170912_01_T1_B5.TIF") as src:
    naip_data_ras = src.read()
    naip_meta = src.profile


with rasterio.open('MyExample.tif', 'w',**naip_meta) as dst:
    dst.write(naip_ndvi, window=window)


# =============================================================================
# with rasterio.open('example.tif') as dataset:
#
#     # Read the dataset's valid data mask as a ndarray.
#     mask = dataset.dataset_mask()
#
#     # Extract feature shapes and values from the array.
#     for geom, val in rasterio.features.shapes(
#             mask, transform=dataset.transform):
#
#         # Transform shapes from the dataset's own coordinate
#         # reference system to CRS84 (EPSG:4326).
#         geom = rasterio.warp.transform_geom(
#             dataset.crs, 'EPSG:4326', geom, precision=6)
#
#         # Print GeoJSON shapes to stdout.
#         print(geom)
# =============================================================================
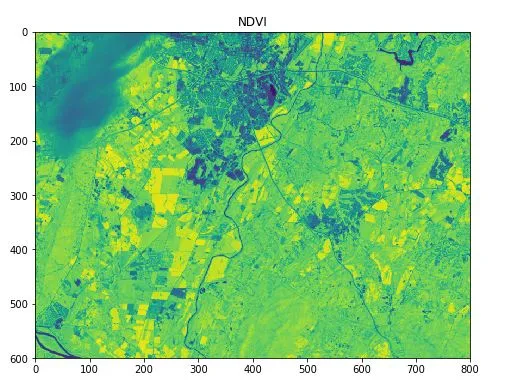
这是我使用matplotlib生成的NDVI图像(我想将其保存为GeoTIFF文件到我的桌面):
感谢您的所有帮助!