使用归一化掩码的NumPy数组绘制Python Matplotlib Plot Hist2d

5

我想使用matplotlib.pyplot.hist2d绘制2D直方图。作为输入,我有掩蔽的numpy.ma数组。像这样,它可以正常工作:

hist2d (arr1,arr2,cmin=1)

然而,如果我想将数组进行归一化处理,使得其值始终在0到1之间,可以使用normed=True关键字,如下所示:
hist2d (arr1,arr2,cmin=1, normed=True)

我遇到了错误。
.../numpy/ma/core.py:3791: UserWarning: Warning: converting a masked element to nan.
  warnings.warn("Warning: converting a masked element to nan.")
.../matplotlib/colorbar.py:561: RuntimeWarning: invalid value encountered in greater
  inrange = (ticks > -0.001) & (ticks < 1.001)
.../matplotlib/colorbar.py:561: RuntimeWarning: invalid value encountered in less
  inrange = (ticks > -0.001) & (ticks < 1.001)
.../matplotlib/colors.py:556: RuntimeWarning: invalid value encountered in less
  cbook._putmask(xa, xa < 0.0, -1)

有什么方法可以解决这个问题并获得一个归一化的二维直方图?
cmin=1: 这是在归一化之后应用的,直方图中将没有任何元素,因为所有的箱子值都会小于1(这些值实际上被设置为NaN)。因此,没有剩下的东西可以绘制! - user707650
是的,这解释了发生了什么。将cmin设置得更低,它就可以正常工作了 - 谢谢。 - red_tiger
1个回答

9

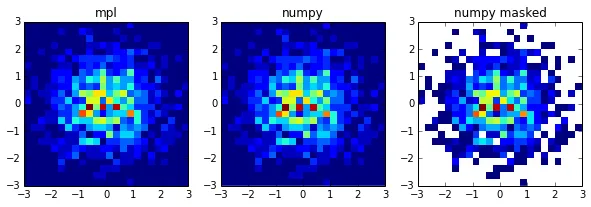
这是因为 cminnormed=True 不兼容。移除 cmin(或将其设置为0)可以解决此问题。如果您确实需要过滤,可以考虑使用numpy的二维直方图函数,然后在输出后对其进行遮罩处理。

a = np.random.randn(1000)
b = np.random.randn(1000)

a_ma = np.ma.masked_where(a > 0, a)
b_ma = np.ma.masked_where(b < 0, b)

bins = np.arange(-3,3.25,0.25)

fig, ax = plt.subplots(1,3, figsize=(10,3), subplot_kw={'aspect': 1})

hist, xbins, ybins, im = ax[0].hist2d(a_ma,b_ma, bins=bins, normed=True)

hist, xbins, ybins = np.histogram2d(a_ma,b_ma, bins=bins, normed=True)
extent = [xbins.min(),xbins.max(),ybins.min(),ybins.max()]

im = ax[1].imshow(hist.T, interpolation='none', origin='lower', extent=extent)
im = ax[2].imshow(np.ma.masked_where(hist == 0, hist).T, interpolation='none', origin='lower', extent=extent)

ax[0].set_title('mpl')
ax[1].set_title('numpy')
ax[2].set_title('numpy masked')

enter image description here


这个方法很有效。接下来几天我会尝试使用numpy的2D直方图。- 谢谢 - red_tiger

网页内容由stack overflow 提供, 点击上面的
可以查看英文原文,
原文链接