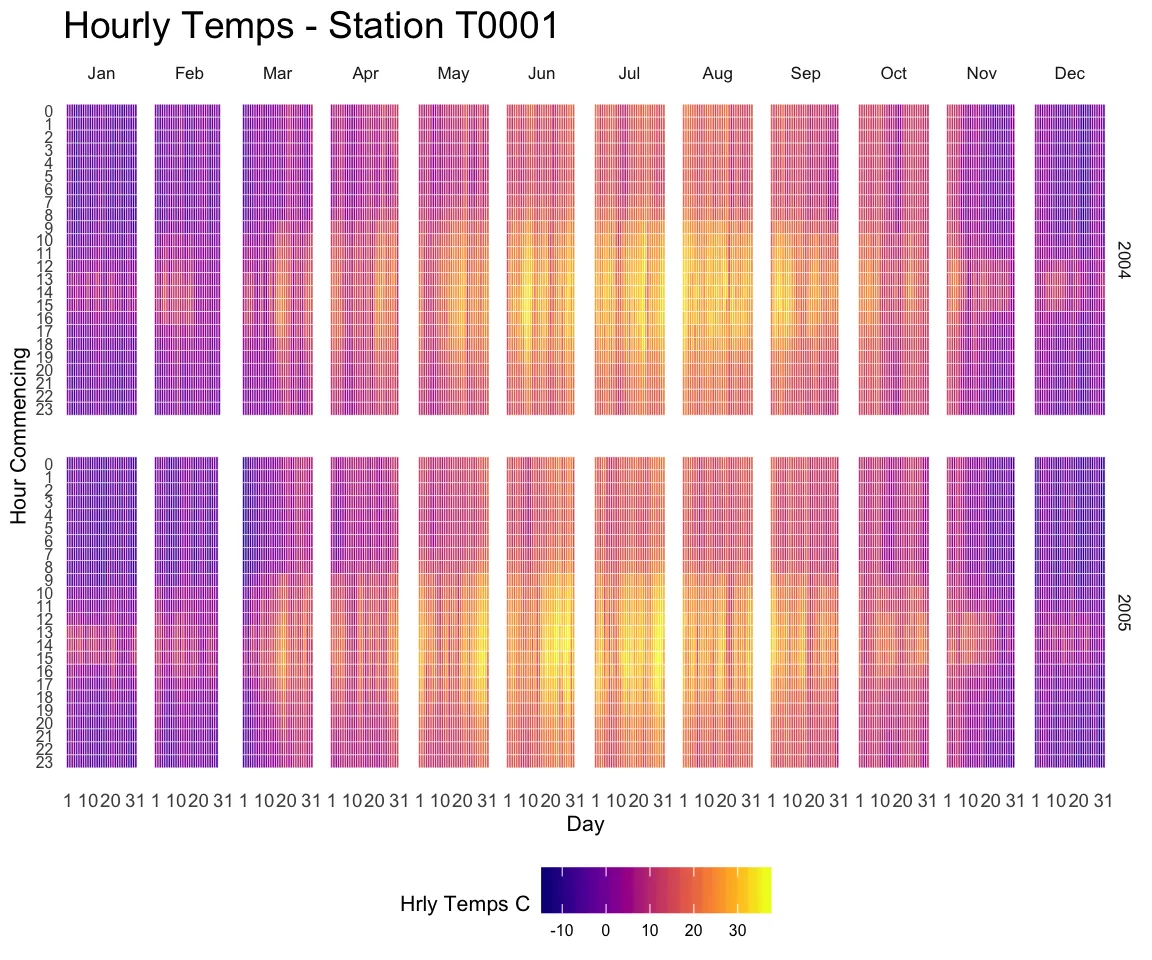
我需要创建一个小时平均多图热力图,显示温度,如下所示:
数据用于绘制的是从Excel表格中读取的。Excel表格格式为"年"、"月"、"日"、"小时"和"温度"。
我使用seaborn库创建了一个月平均热力图,使用以下代码:
df = pd.read_excel('D:\\Users\\CO2_heatmap.xlsx')
co2=df.pivot_table(index="month",columns="year",values='CO2',aggfunc="mean")
ax = sns.heatmap(co2,cmap='bwr',vmin=370,vmax=430, cbar_kws={'label': '$\mathregular{CO_2}$ [ppm]', 'orientation': 'vertical'})
获取此图表:

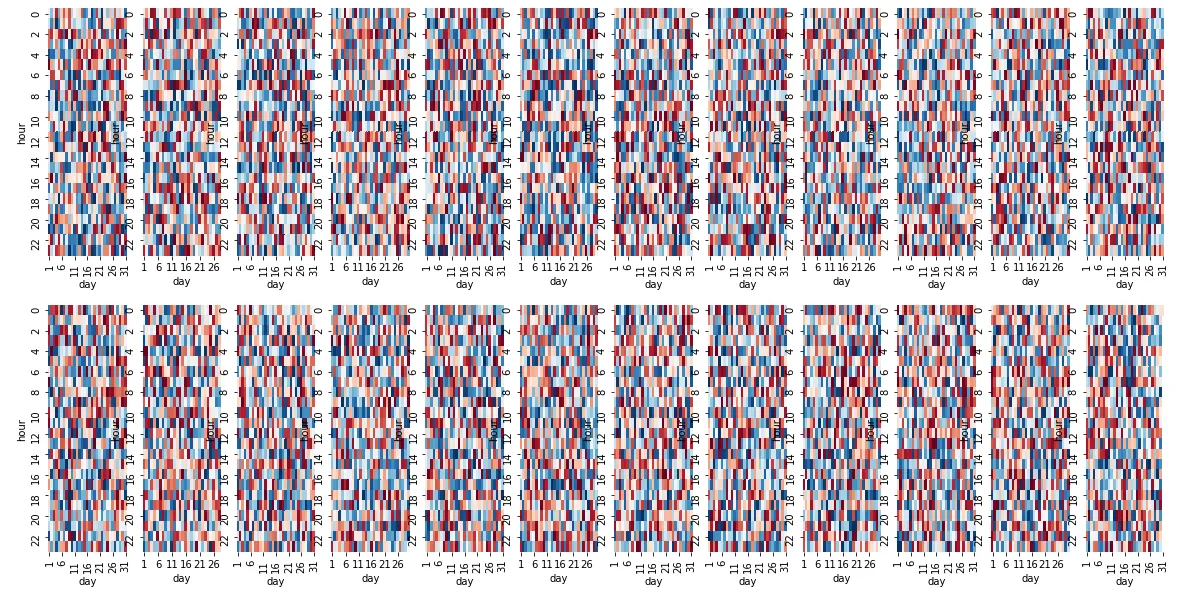
我该如何生成一个
co2=df.pivot_table(index="hour",columns="day",values='CO2',aggfunc="mean")
每个月和每年都要做什么?