如何在 kdeplot 中添加颜色条

4
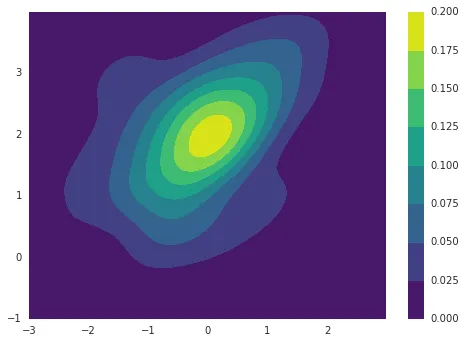
我想使用seaborn.kdeplot创建一个带有侧边色条的核密度估计图。
import matplotlib.pyplot as plt
import seaborn as sns
import numpy as np; np.random.seed(10)
import seaborn as sns; sns.set(color_codes=True)

mean, cov = [0, 2], [(1, .5), (.5, 1)]
x, y = np.random.multivariate_normal(mean, cov, size=50).T
sns.kdeplot(x, y ,shade=True)
plt.show()

在创建核密度估计时,我不知道如何创建颜色条。我尝试使用plt.colorbar()但没有成功。


请参见 https://github.com/mwaskom/seaborn/issues/312 - Bart
1
@Bart 的问题已经关闭,现在已经实现了,请查看下面的链接:[https://dev59.com/DZrga4cB1Zd3GeqPnX1-#62151872] - imbr
2个回答

10

现在它已经实现了!参数cbar=True

您还可以使用shade_lowest=False来不对第一级进行着色。

import seaborn as sns
import numpy as np
import matplotlib.pylab as plt

x, y = np.random.randn(2, 300)
sns.kdeplot(x=x, y=y, zorder=0, n_levels=6, shade=True, 
    cbar=True, shade_lowest=False, cmap='viridis')

enter image description here


7

您需要直接调用scipy KDE和matplotlib等高线函数,但只需稍微添加一些额外的代码:

import matplotlib.pyplot as plt
import seaborn as sns
import numpy as np; np.random.seed(10)
import seaborn as sns; sns.set(color_codes=True)
from scipy import stats

mean, cov = [0, 2], [(1, .5), (.5, 1)]
data = np.random.multivariate_normal(mean, cov, size=50).T

kde = stats.gaussian_kde(data)
xx, yy = np.mgrid[-3:3:.01, -1:4:.01]
density = kde(np.c_[xx.flat, yy.flat].T).reshape(xx.shape)

f, ax = plt.subplots()
cset = ax.contourf(xx, yy, density, cmap="viridis")
f.colorbar(cset)

enter image description here


只是出于好奇,sns.kdeplot 返回 Axes 实例时同时返回 cset 会有多难? - tmdavison
1
虽然在技术上实现并不困难,但这将违反所有轴级 seaborn 函数的预期行为,并且会破坏任何使用返回值的现有代码。在我看来,如果 matplotlib 像其他绘图对象(线条、集合等)一样将 cset 添加到轴对象中,那将是更可取的。 - mwaskom
我明白了。谢谢你的回复。 - tmdavison

网页内容由stack overflow 提供, 点击上面的
可以查看英文原文,
原文链接