我有一个数据框df,我使用其中的几列进行groupby:
df['col1','col2','col3','col4'].groupby(['col1','col2']).mean()
以上的方法,我几乎得到了我需要的表格(数据框)。缺少的是一个包含每个组中行数的附加列。换句话说,我有平均值,但我也想知道用于获得这些平均值的数量。例如,在第一组中有8个值,在第二组中有10个值,依此类推。
简而言之:如何为数据框获取按组分的统计信息?
我有一个数据框df,我使用其中的几列进行groupby:
df['col1','col2','col3','col4'].groupby(['col1','col2']).mean()
获取每个分组的行数最简单的方法是调用.size(),它返回一个Series:
df.groupby(['col1','col2']).size()
DataFrame(而不是Series)来处理,因此可以执行以下操作:df.groupby(['col1', 'col2']).size().reset_index(name='counts')
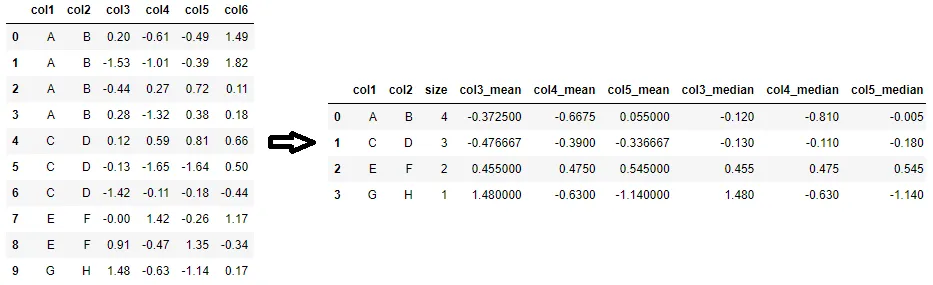
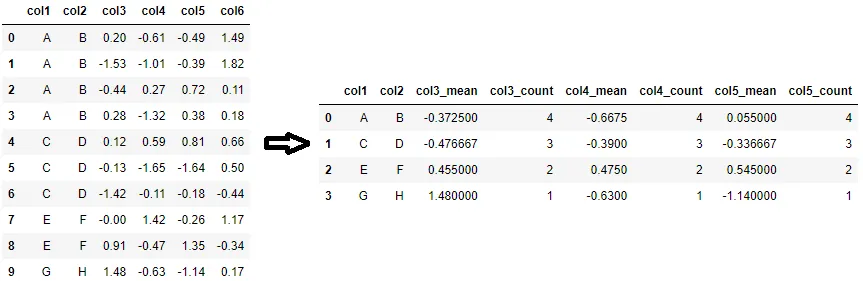
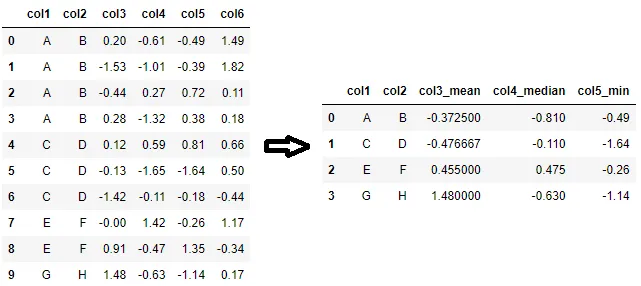
考虑以下示例数据帧:
In [2]: df
Out[2]:
  col1 col2  col3  col4  col5  col6
0    A    B  0.20 -0.61 -0.49  1.49
1    A    B -1.53 -1.01 -0.39  1.82
2    A    B -0.44  0.27  0.72  0.11
3    A    B  0.28 -1.32  0.38  0.18
4    C    D  0.12  0.59  0.81  0.66
5    C    D -0.13 -1.65 -1.64  0.50
6    C    D -1.42 -0.11 -0.18 -0.44
7    E    F -0.00  1.42 -0.26  1.17
8    E    F  0.91 -0.47  1.35 -0.34
9    G    H  1.48 -0.63 -1.14  0.17
首先,让我们使用 .size() 函数获取行数:
In [3]: df.groupby(['col1', 'col2']).size()
Out[3]:
col1  col2
A     B       4
C     D       3
E     F       2
G     H       1
dtype: int64
然后使用.size().reset_index(name='counts')来获取行数:
In [4]: df.groupby(['col1', 'col2']).size().reset_index(name='counts')
Out[4]:
  col1 col2  counts
0    A    B       4
1    C    D       3
2    E    F       2
3    G    H       1
当您想要计算分组数据的统计信息时,通常看起来像这样:
In [5]: (df
   ...: .groupby(['col1', 'col2'])
   ...: .agg({
   ...:     'col3': ['mean', 'count'],
   ...:     'col4': ['median', 'min', 'count']
   ...: }))
Out[5]:
            col4                  col3
          median   min count      mean count
col1 col2
A    B    -0.810 -1.32     4 -0.372500     4
C    D    -0.110 -1.65     3 -0.476667     3
E    F     0.475 -0.47     2  0.455000     2
G    H    -0.630 -0.63     1  1.480000     1
join 进行组合。效果如下:In [6]: gb = df.groupby(['col1', 'col2'])
...: counts = gb.size().to_frame(name='counts')
...: (counts
...: .join(gb.agg({'col3': 'mean'}).rename(columns={'col3': 'col3_mean'}))
...: .join(gb.agg({'col4': 'median'}).rename(columns={'col4': 'col4_median'}))
...: .join(gb.agg({'col4': 'min'}).rename(columns={'col4': 'col4_min'}))
...: .reset_index()
...: )
...:
Out[6]:
col1 col2 counts col3_mean col4_median col4_min
0 A B 4 -0.372500 -0.810 -1.32
1 C D 3 -0.476667 -0.110 -1.65
2 E F 2 0.455000 0.475 -0.47
3 G H 1 1.480000 -0.630 -0.63
以下是生成测试数据的代码:
In [1]: import numpy as np
   ...: import pandas as pd
   ...:
   ...: keys = np.array([
   ...:         ['A', 'B'],
   ...:         ['A', 'B'],
   ...:         ['A', 'B'],
   ...:         ['A', 'B'],
   ...:         ['C', 'D'],
   ...:         ['C', 'D'],
   ...:         ['C', 'D'],
   ...:         ['E', 'F'],
   ...:         ['E', 'F'],
   ...:         ['G', 'H']
   ...:         ])
   ...:
   ...: df = pd.DataFrame(
   ...:     np.hstack([keys,np.random.randn(10,4).round(2)]),
   ...:     columns = ['col1', 'col2', 'col3', 'col4', 'col5', 'col6']
   ...: )
   ...:
   ...: df[['col3', 'col4', 'col5', 'col6']] = \
   ...:     df[['col3', 'col4', 'col5', 'col6']].astype(float)
   ...:
免责声明:
如果你要聚合的某些列具有空值,则你确实希望独立聚合每个列的组行计数。否则,你可能会被误导,以为有多少记录实际上用于计算像均值这样的东西,因为pandas将在均值计算中删除NaN条目而没有告诉你。
groupby 对象上,agg 函数可以接受一个列表,一次性应用多个聚合方法。这将给你所需的结果:df[['col1', 'col2', 'col3', 'col4']].groupby(['col1', 'col2']).agg(['mean', 'count'])
df[['col1','col2','col3','col4']].groupby(['col1','col2']).agg(['mean', 'count'])? - rysquicount 列,请查看我的答案。 - Pedro M DuarteGroupBy.describe按组返回count,mean,std和其他有用的统计信息。
df.groupby(['A', 'B'])['C'].describe()

           count  mean   std   min   25%   50%   75%   max
A   B
bar one      1.0  0.40   NaN  0.40  0.40  0.40  0.40  0.40
    three    1.0  2.24   NaN  2.24  2.24  2.24  2.24  2.24
    two      1.0 -0.98   NaN -0.98 -0.98 -0.98 -0.98 -0.98
foo one      2.0  1.36  0.58  0.95  1.15  1.36  1.56  1.76
    three    1.0 -0.15   NaN -0.15 -0.15 -0.15 -0.15 -0.15
    two      2.0  1.42  0.63  0.98  1.20  1.42  1.65  1.87
要获取特定的统计数据,只需选择它们即可。
df.groupby(['A', 'B'])['C'].describe()[['count', 'mean']]

           count      mean
A   B
bar one      1.0  0.400157
    three    1.0  2.240893
    two      1.0 -0.977278
foo one      2.0  1.357070
    three    1.0 -0.151357
    two      2.0  1.423148
注意:如果您只需要计算1或2个统计量,那么使用
groupby.agg并仅计算这些列可能会更快,否则您将执行浪费计算。
describe 可用于多列数据(将 ['C'] 更改为 ['C', 'D']——或完全删除它——并查看发生了什么,结果是一个带有多级索引的列型数据帧)。
对于字符串数据,您还可以获得不同的统计信息。以下是一个示例:
df2 = df.assign(D=list('aaabbccc')).sample(n=100, replace=True)

with pd.option_context('precision', 2):
    display(df2.groupby(['A', 'B'])
               .describe(include='all')
               .dropna(how='all', axis=1))

              C                                                   D
          count  mean       std   min   25%   50%   75%   max count unique top freq
A   B
bar one    14.0  0.40  5.76e-17  0.40  0.40  0.40  0.40  0.40    14      1   a   14
    three  14.0  2.24  4.61e-16  2.24  2.24  2.24  2.24  2.24    14      1   b   14
    two     9.0 -0.98  0.00e+00 -0.98 -0.98 -0.98 -0.98 -0.98     9      1   c    9
foo one    22.0  1.43  4.10e-01  0.95  0.95  1.76  1.76  1.76    22      2   a   13
    three  15.0 -0.15  0.00e+00 -0.15 -0.15 -0.15 -0.15 -0.15    15      1   c   15
    two    26.0  1.49  4.48e-01  0.98  0.98  1.87  1.87  1.87    26      2   b   15
要了解更多信息,请查看文档。
DataFrame.value_counts如果只想捕获每个组的大小,则可以从 pandas 1.1 开始使用此功能,这将减少 GroupBy 并提高速度。
df.value_counts(subset=['col1', 'col2'])
极简示例
# Setup
np.random.seed(0)
df = pd.DataFrame({'A' : ['foo', 'bar', 'foo', 'bar',
                          'foo', 'bar', 'foo', 'foo'],
                   'B' : ['one', 'one', 'two', 'three',
                          'two', 'two', 'one', 'three'],
                   'C' : np.random.randn(8),
                   'D' : np.random.randn(8)})

df.value_counts(['A', 'B'])

A    B
foo  two      2
     one      2
     three    1
bar  two      1
     three    1
     one      1
dtype: int64
如果您在上面没有找到您要查找的内容,用户指南 中列出了全面支持的静态分析、相关性和回归工具。
.describe()[['count', 'mean']],您计算了您之后要删除的统计信息。使用.agg(['count', 'mean']是更好的选择,速度大约快7倍,因为您只计算实际需要的统计信息。 - Hugolmn要获取多个统计数据,请折叠索引并保留列名:
df = df.groupby(['col1','col2']).agg(['mean', 'count'])
df.columns = [ ' '.join(str(i) for i in col) for col in df.columns]
df.reset_index(inplace=True)
df
生成:
df.columns = [ '_'.join(str(i) for i in col) for col in df.columns]。 - pauljohn32我们可以使用groupby和count轻松完成,但是要记得使用reset_index()。
df[['col1','col2','col3','col4']].groupby(['col1','col2']).count().\
reset_index()
请尝试这段代码
new_column=df[['col1', 'col2', 'col3', 'col4']].groupby(['col1', 'col2']).count()
df['count_it']=new_column
df
grp = df.groupby(['col1',  'col2',  'col3'])

grp.max()
grp.mean()
grp.describe()
from datar.all import tibble, rnorm, f, group_by, summarise, mean, n, rep

df = tibble(
  col1=rep(['A', 'B'], 5),
  col2=rep(['C', 'D'], each=5),
  col3=rnorm(10),
  col4=rnorm(10)
)
df >> group_by(f.col1, f.col2) >> summarise(
  count=n(),
  col3_mean=mean(f.col3),
  col4_mean=mean(f.col4)
)
  col1 col2  n  mean_col3  mean_col4
0    A    C  3  -0.516402   0.468454
1    A    D  2  -0.248848   0.979655
2    B    C  2   0.545518  -0.966536
3    B    D  3  -0.349836  -0.915293
[Groups: ['col1'] (n=2)]
我是datar软件包的作者。如果您在使用过程中有任何问题,请随时提交问题。
另一种选择:
import pandas as pd
import numpy as np

df = pd.DataFrame({'A' : ['foo', 'bar', 'foo', 'bar',
                          'foo', 'bar', 'foo', 'foo'],
                   'B' : ['one', 'one', 'two', 'three',
                          'two', 'two', 'one', 'three'],
                   'C' : np.random.randn(8),
                   'D' : np.random.randn(8)})
df

    A   B       C           D
0   foo one   0.808197   2.057923
1   bar one   0.330835  -0.815545
2   foo two  -1.664960  -2.372025
3   bar three 0.034224   0.825633
4   foo two   1.131271  -0.984838
5   bar two   2.961694  -1.122788
6   foo one   -0.054695  0.503555
7   foo three 0.018052  -0.746912
pd.crosstab(df.A, df.B).stack().reset_index(name='count')
输出:
    A   B     count
0   bar one     1
1   bar three   1
2   bar two     1
3   foo one     2
4   foo three   1
5   foo two     2
aggfunc进行pivot_table对于聚合统计数据框,也可以使用pivot_table。它生成的表格与Excel透视表相似。基本思路是将要聚合的列作为values=传入,将分组列作为index=传入,将任何聚合器函数作为aggfunc=传入(所有可用于groupby.agg的优化函数都可以)。
pivot_table相对于groupby.agg的一个优点是,对于多个列,它会生成单个size列,而groupby.agg会为每个列创建一个size列(除了一个之外,其他都是冗余的)。
agg_df = df.pivot_table(
    values=['col3', 'col4', 'col5'],
    index=['col1', 'col2'],
    aggfunc=['size', 'mean', 'median']
).reset_index()
# flatten the MultiIndex column (should be omitted if MultiIndex is preferred)
agg_df.columns = [i if not j else f"{j}_{i}" for i,j in agg_df.columns]
对于自定义列名,不要使用多个rename调用,而是从一开始就使用命名聚合。
来自文档:
为了支持具有对输出列名称的控制的特定于列的聚合,pandas在GroupBy.agg()中接受特殊语法,称为“命名聚合”,其中
- 关键字是输出列名称
- 值是元组,其第一个元素是要选择的列,第二个元素是要应用于该列的聚合。 pandas提供了pandas.NamedAgg命名元组,其字段为['column','aggfunc'],以使参数更清晰。通常,聚合可以是可调用对象或字符串别名。
例如,要生成聚合数据框,其中每个col3、col4和col5都计算其平均值和计数,则可以使用以下代码。请注意,它将重命名列步骤作为groupby.agg的一部分。
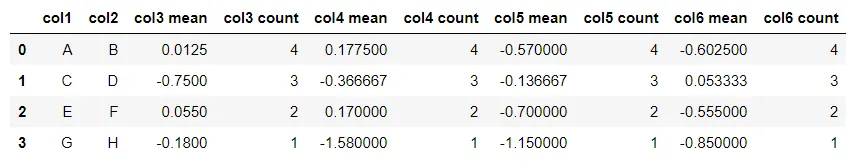
aggfuncs = {f'{c}_{f}': (c, f) for c in ['col3', 'col4', 'col5'] for f in ['mean', 'count']}
agg_df = df.groupby(['col1', 'col2'], as_index=False).agg(**aggfuncs)
命名聚合的另一个用例是如果每个列需要不同的聚合函数。例如,如果只需要col3的平均值、col4的中位数和col5的min,并且需要自定义列名称,则可以使用以下代码完成。
agg_df = df.groupby(['col1', 'col2'], as_index=False).agg(col3_mean=('col3', 'mean'), col4_median=('col4', 'median'), col5_min=('col5', 'min'))
# or equivalently,
agg_df = df.groupby(['col1', 'col2'], as_index=False).agg(**{'_'.join(p): p for p in [('col3', 'mean'), ('col4', 'median'), ('col5', 'min')]})
In [5]: counts_df = pd.DataFrame(df.groupby('col1').size().rename('counts'))这一行代码,如果您希望进一步操作数据框,则最好将 size() 设置为一个新列,这应该是counts_df = pd.DataFrame(df.groupby('col1').size().reset_index(name='counts'))。 - LancelotHolmesisnull添加到此查询中,以便在一个列中呈现?'col4': ['median', 'min', 'count', 'isnull']- Peter.kreset_index之外,获取DataFrame的另一种方法是使用as_index参数:df.groupby(['col1','col2'],as_index=False).size()。我习惯在所有的groupby中使用as_index=False。 - flow2k