我希望用Python生成一个矩形脉冲。我相信可以使用NumPy或SciPy来完成。但是我无法从API中获取相关信息。在生成矩形脉冲后,我将使用Matplotlib进行绘图。
2个回答
6
创建一个一维数组,除了一段1.0值的矩形脉冲外,其余都是零:
import numpy as np
a = np.zeros( (1000,) )   # whatever size. initializes to zeros
a[150:180] = 1.0          # index range sets location, width of impulse
查看绘图:
import matplotlib.pyplot as mp
mp.plot(a)
mp.show()
- DarenW
1
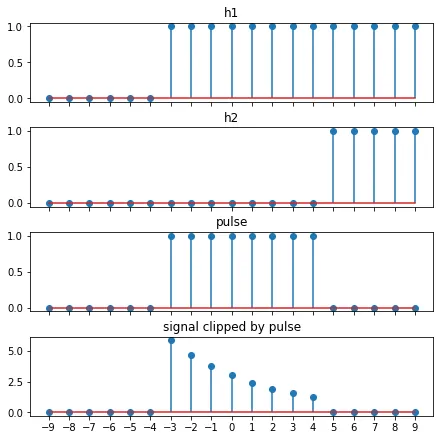
你也可以使用Heaviside函数(在工程中也称为单位阶跃函数),例如numpy.heaviside。通过两个Heaviside序列之间的差异创建脉冲:
n = np.arange(1-N, N)
n1, n2 = -3, 5 # pulse limits
pn = np.heaviside(n-n1, 1) - np.heaviside(n-n2, 1)
Heaviside 函数根据输入数组的值进行更改,将其变为 0、常量或 1,具体取决于它们是负数、零还是正数。在这里,输入数组包含相应索引的偏移量而形成的索引值,并且常量为 1。
完整代码
import numpy as np
import matplotlib.pyplot as plt
import matplotlib.ticker as tck


# Sample numbers
N = 10
n = np.arange(1-N, N)

# Pulse limits
n1, n2 = -3, 5
pn = np.heaviside(n-n1, 1) - np.heaviside(n-n2, 1)

# Some signal clipped by pulse
xn = 3 * 0.8**n * pn

# Plot everything
fig, axes = plt.subplots(figsize=(6,6), nrows=4, sharex=True, layout='constrained')
axes = axes.flatten()

for ax, p, title in zip(axes[:2], [n1, n2], ['h1', 'h2']):
    ax.set_title(title)
    h = np.heaviside(n-p, 1)
    ax.stem(n, h)

for ax, s, title in zip(axes[2:], [pn, xn], ['pulse', 'signal clipped by pulse']):
    ax.set_title(title)
    ax.stem(n, s)

ax.xaxis.set_major_locator(tck.MultipleLocator())
- mins
网页内容由stack overflow 提供, 点击上面的可以查看英文原文,
原文链接
原文链接