我想制作一个非常简单的多级饼图,就像您在下面看到的那样:
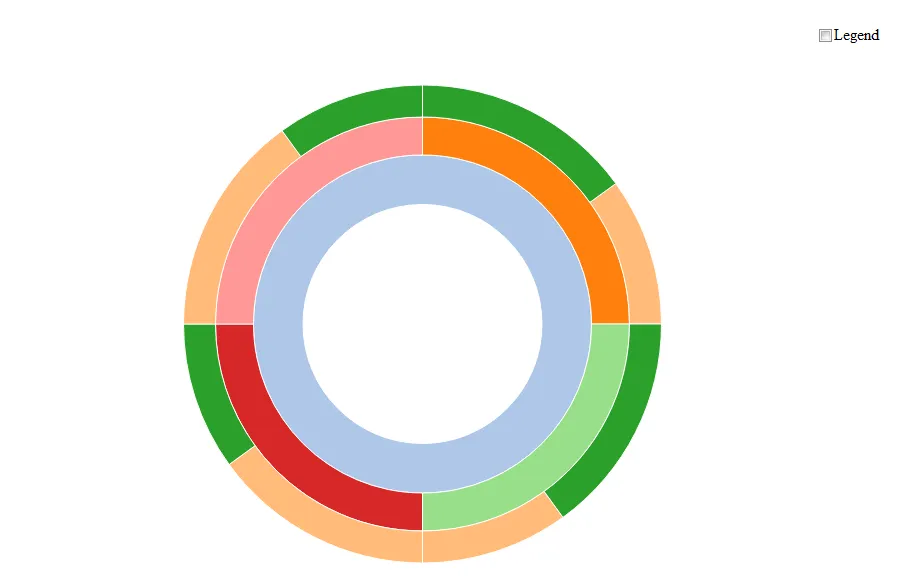
您可以看到,我已经了解了sunburstR,但(因为我正在寻找更简单的解决方案),那并不是完全正确的。此外,我希望能够轻松将其导出为矢量图形。
使用ggplot2在极坐标下绘制图形的第二种解决方案对于这样一个简单的绘图似乎过于复杂。
如果您能帮助我,我会很高兴!先感谢您!
SP
    library("ggplot2")
    df <- data.frame(a = c(4, 3, 3, 8, 1, 1, 10),
                     b = c("x", "x", "x", "y", "y", "y", "z"),
                     c = c("x1", "x2", "x3", "y1", "y2", "y3", "z1"))

    ggplot(df, aes(x = b, y = a, fill = c))+
      geom_bar(stat = "identity")+
      coord_polar(theta="y")