基本上我有两个数组,一个包含x轴的值,第二个包含y轴的值。问题是,当我执行操作时
plt.semilogy(out_samp,error_mc)
我遇到了这个问题
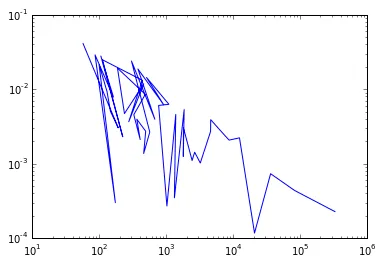
这个图看起来没有任何意义。原因是plot函数按照x数组中出现的顺序绘制所有点,而不关心它们是否按升序排序。我该如何对这两个数组进行排序,以便按递增值对x数组排序并以相同的方式对y轴排序,以便点相同但是图被连接在一起,这样就不会出现这种混乱情况了?
基本上我有两个数组,一个包含x轴的值,第二个包含y轴的值。问题是,当我执行操作时
plt.semilogy(out_samp,error_mc)
我遇到了这个问题
这个图看起来没有任何意义。原因是plot函数按照x数组中出现的顺序绘制所有点,而不关心它们是否按升序排序。我该如何对这两个数组进行排序,以便按递增值对x数组排序并以相同的方式对y轴排序,以便点相同但是图被连接在一起,这样就不会出现这种混乱情况了?
将这两个数据列表压缩成一个,排序后再解压缩,这样做会更容易。
例如:
xs = [...]
ys = [...]

xs, ys = zip(*sorted(zip(xs, ys)))

plot(xs, ys)
查看zip文档请点击这里:https://docs.python.org/3.5/library/functions.html#zip
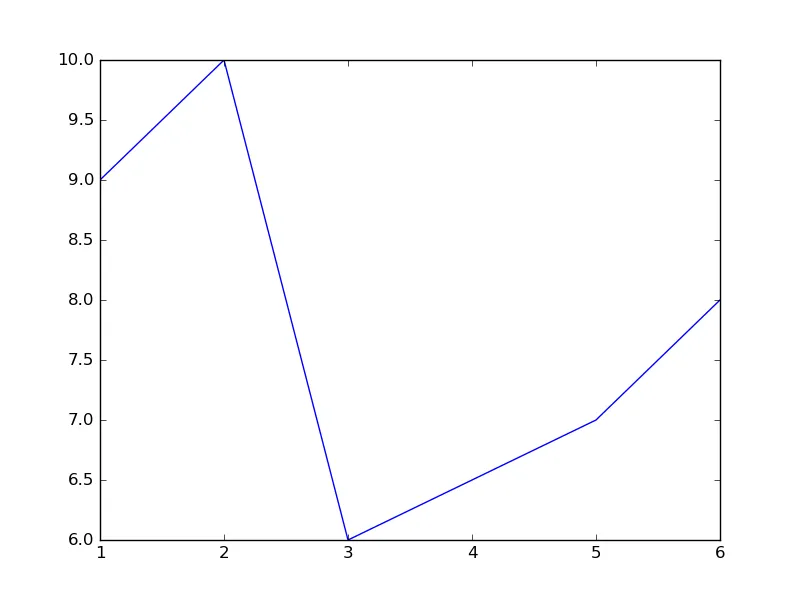
在绘图之前按x轴的值进行排序。这是一个MWE。
import itertools

x = [3, 5, 6, 1, 2]
y = [6, 7, 8, 9, 10]

lists = sorted(itertools.izip(*[x, y]))
new_x, new_y = list(itertools.izip(*lists))

# import operator
# new_x = map(operator.itemgetter(0), lists)        # [1, 2, 3, 5, 6]
# new_y = map(operator.itemgetter(1), lists)        # [9, 10, 6, 7, 8]

# Plot
import matplotlib.pylab as plt
plt.plot(new_x, new_y)
plt.show()
对于小型数据,zip(如其他回答者所提到的)已经足够了。
new_x, new_y = zip(*sorted(zip(x, y)))
结果为,
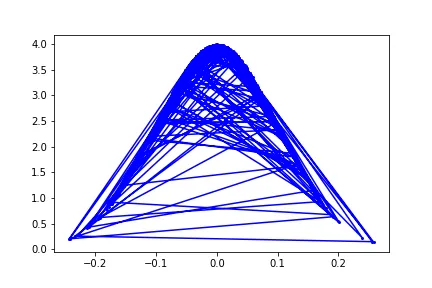
zip需要立即获取所有项。而izip只会推进底层迭代器。 - SparkAndShine一种排序列表的替代方法是使用NumPy数组并使用np.sort()进行排序。使用数组的优点是在计算像y=f(x)这样的函数时可以进行矢量化操作。以下是绘制正态分布的示例:
不使用排序数据
mu, sigma = 0, 0.1
x = np.random.normal(mu, sigma, 200)
f = 1/(sigma * np.sqrt(2 * np.pi)) *np.exp( - (x - mu)**2 / (2 * sigma**2) )
plt.plot(x,f, '-bo', ms = 2)
输出 1
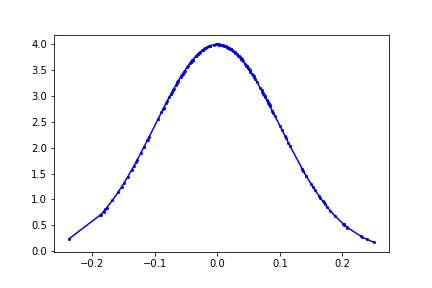
使用 np.sort() 函数,可以在计算正态分布时直接使用排序后的数组 x。
mu, sigma = 0, 0.1
x = np.sort(np.random.normal(mu, sigma, 200))
# or use x = np.random.normal(mu, sigma, 200).sort()
f = 1/(sigma * np.sqrt(2 * np.pi)) *np.exp( - (x - mu)**2 / (2 * sigma**2) )
plt.plot(x,f, '-bo', ms = 2)
如果您已经有未排序的x和y数据,您可以使用numpy.argsort进行后排序。
mu, sigma = 0, 0.1
x = np.random.normal(mu, sigma, 200)
f = 1/(sigma * np.sqrt(2 * np.pi)) *np.exp( - (x - mu)**2 / (2 * sigma**2) )
plt.plot(np.sort(x), f[np.argsort(x)], '-bo', ms = 2)
sort():首先使用 np.sort(x),然后使用 f[np.argsort(x)]。可以将总的 sort() 调用次数减少到一次:# once you have your x and f...
indices = np.argsort(x)
plt.plot(x[indices], f[indices], '-bo', ms = 2)
sort(x) 一次来进一步提高性能。 - Thomas Kühnnp.sort(x),其次是当你执行 f[np.argsort(x)]。我会改为这样做:indices = np.argsort(x),然后通过以下方式绘图:plt.plot(x[indices], f[indices]) - pfabri只需要做这个
list=zip(*sorted(zip(*(x,y))))
plt.plot(*list)
sorted函数将根据第一个参数即x值进行排序。
我认为你需要对一个数组进行排序,另一个数组也应该根据第一个数组进行排序。我从其他一些stackoverflow问题中得到了这个解决方案。很可能这应该是你的解决方案。
out_samp,error_mc=zip(*sorted(zip(out_samp,error_mc)))