Matplotlib绘图窗口黑屏

3

我最近开始学习Python和Matplotlib。我遇到的问题是,我总是得到一个黑色窗口作为绘图输出。

请看下面的简单代码。

import numpy as np
import matplotlib.pyplot as plt
import pylab


x = np.arange(0, 5, 0.1)
y = np.sin(x)

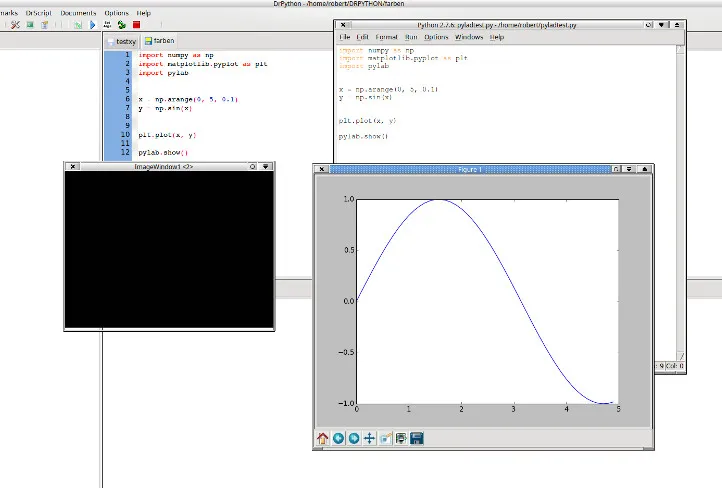
#plot the x and y and you are supposed to see a sine curve
plt.plot(x, y)

pylab.show()

屏幕截图

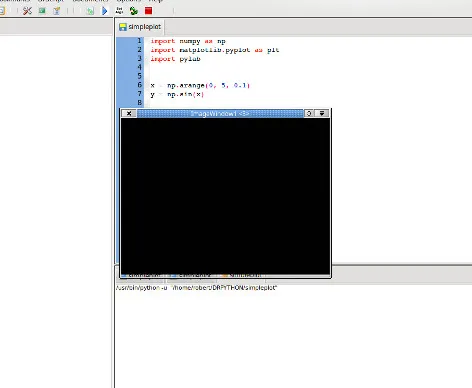
执行matplotlib页面的代码示例时,我得到了相同的结果。有人知道这是从哪里来的,如何克服它吗?

我使用的操作系统是Linux Mint。


抱歉!操作系统 Linux Mint。 - Robert
实际上不建议使用pylab,可以尝试使用plt.show()代替,也许会有所帮助?http://matplotlib.org/faq/usage_faq.html#matplotlib-pyplot-and-pylab-how-are-they-related - Oleg Medvedyev
相同的结果,黑色窗口。 - Robert
执行 matplotlib.get_backend() 输出 'TkAgg'。 - Robert
@Robert 我建议你重新安装 Tkintermatplotlib。根据这篇帖子,Unix系统上的TkAgg存在一些问题。另一个方法是尝试更改你的后端 - Vadim Shkaberda
显示剩余3条评论
1个回答

1

我在Python shell中执行代码是可以的,但在Python编辑器中执行代码就出现了问题。我使用了两个不同的编辑器。

enter image description here

最好的问候,

罗伯特


你使用的是哪些编辑器? - IntegrateThis

网页内容由stack overflow 提供, 点击上面的
可以查看英文原文,
原文链接