要绘制一系列连续的随机线图,您需要在matplotlib中使用动画:
import numpy as np
import matplotlib.pyplot as plt
import matplotlib.animation as animation
fig, ax = plt.subplots()
max_x = 5
max_rand = 10
x = np.arange(0, max_x)
ax.set_ylim(0, max_rand)
line, = ax.plot(x, np.random.randint(0, max_rand, max_x))
def init():
line.set_ydata([np.nan] * len(x))
return line,
def animate(i):
line.set_ydata(np.random.randint(0, max_rand, max_x))
return line,
ani = animation.FuncAnimation(
fig, animate, init_func=init, interval=1000, blit=True, save_count=10)
plt.show()
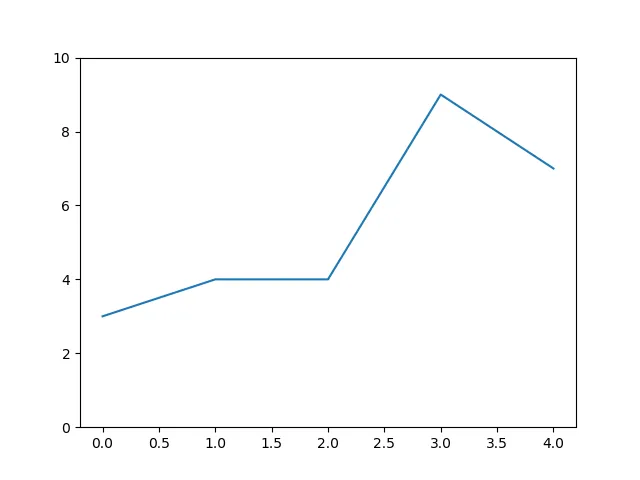
这里的想法是你有一个包含x和y值的图表。其中x只是一个范围,例如0到5。然后调用animation.FuncAnimation()告诉matplotlib每隔1000ms调用你的animate()函数,让你提供新的y值。
你可以通过修改interval参数来加快速度。
如果你想要随时间绘制值,一种可能的方法是使用deque()来保存y值,然后使用x轴来保存几秒前的值:
from collections import deque
import numpy as np
import matplotlib.pyplot as plt
import matplotlib.animation as animation
from matplotlib.ticker import FuncFormatter
def init():
line.set_ydata([np.nan] * len(x))
return line,
def animate(i):
data.append(np.random.randint(0, max_rand))
line.set_ydata(data)
plt.savefig('e:\\python temp\\fig_{:02}'.format(i))
print(i)
return line,
max_x = 10
max_rand = 5
data = deque(np.zeros(max_x), maxlen=max_x)
x = np.arange(0, max_x)
fig, ax = plt.subplots()
ax.set_ylim(0, max_rand)
ax.set_xlim(0, max_x-1)
line, = ax.plot(x, np.random.randint(0, max_rand, max_x))
ax.xaxis.set_major_formatter(FuncFormatter(lambda x, pos: '{:.0f}s'.format(max_x - x - 1)))
plt.xlabel('Seconds ago')
ani = animation.FuncAnimation(
fig, animate, init_func=init, interval=1000, blit=True, save_count=10)
plt.show()
给你:
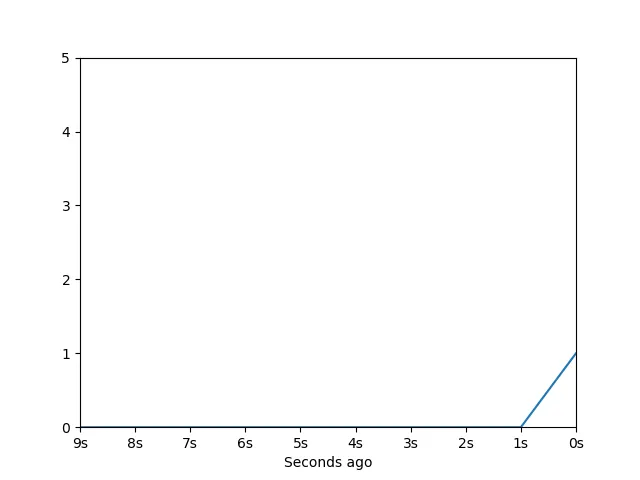
(该内容为图片,无法直接翻译。)