如何从Seaborn distplot的拟合中获取适合的参数 fit=?

11

我正在使用seaborn的distplot函数,其中包含参数fit=stats.gamma。

我如何获取返回的拟合参数?

以下是一个示例:

import numpy as np
import pandas as pd
import seaborn as sns
from scipy import stats
df = pd.read_csv ('RequestSize.csv')
import matplotlib.pyplot as plt
reqs = df['12 web pages']
reqs = reqs.dropna()
reqs = reqs[np.logical_and (reqs > np.percentile (reqs, 0), reqs < np.percentile (reqs, 95))]
dist = sns.distplot (reqs, fit=stats.gamma)
2个回答

9
使用你传递给 distplot 的对象:
stats.gamma.fit(reqs)

7

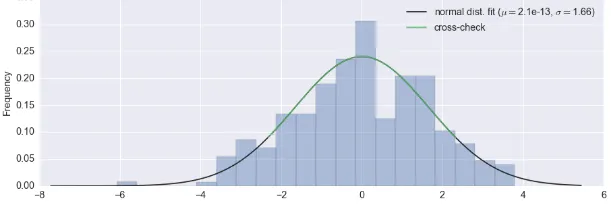
我确认上述内容是真实的——sns.distplot拟合方法等效于scipy.stats中的拟合方法,因此您可以从那里获取参数,例如:

from scipy import stats

ax = sns.distplot(e_t_hat, bins=20, kde=False, fit=stats.norm);
plt.title('Distribution of Cointegrating Spread for Brent and Gasoil')

# Get the fitted parameters used by sns
(mu, sigma) = stats.norm.fit(e_t_hat)
print "mu={0}, sigma={1}".format(mu, sigma)

# Legend and labels 
plt.legend(["normal dist. fit ($\mu=${0:.2g}, $\sigma=${1:.2f})".format(mu, sigma)])
plt.ylabel('Frequency')

# Cross-check this is indeed the case - should be overlaid over black curve
x_dummy = np.linspace(stats.norm.ppf(0.01), stats.norm.ppf(0.99), 100)
ax.plot(x_dummy, stats.norm.pdf(x_dummy, mu, sigma))
plt.legend(["normal dist. fit ($\mu=${0:.2g}, $\sigma=${1:.2f})".format(mu, sigma),
           "cross-check"])

enter image description here


这是关于正态分布的内容。OP正在使用伽马分布。你知道如何解释stats.gamma.fit()返回的三个值吗? - Chris J. Vargo
@ChrisJ.Vargo: shape、loc、scale = stats.gamma.fit(data) - Shubham Bansal

网页内容由stack overflow 提供, 点击上面的
可以查看英文原文,
原文链接