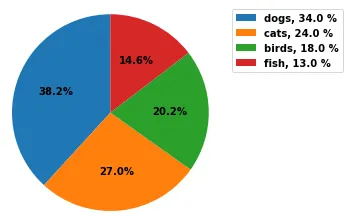
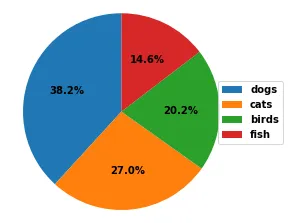
我已使用matplotlib创建了以下饼图:
import matplotlib.pyplot as plt
labels = ['dogs','cats','birds','fish']
sizes = [34, 24,18,13]
pie = plt.pie(sizes,autopct='%1.1f%%', startangle=90)
plt.axis('equal')
plt.legend( loc = 'right', labels=labels)
plt.show()
有没有办法将饼图上的百分比放在图例中,使得图例内容如下:
狗,34%
猫,24%
鸟,18%
鱼,13%
我知道最快、最优雅的方式是将 "labels" 更改为上述内容,但如果直到运行代码后才知道 "sizes" 呢?