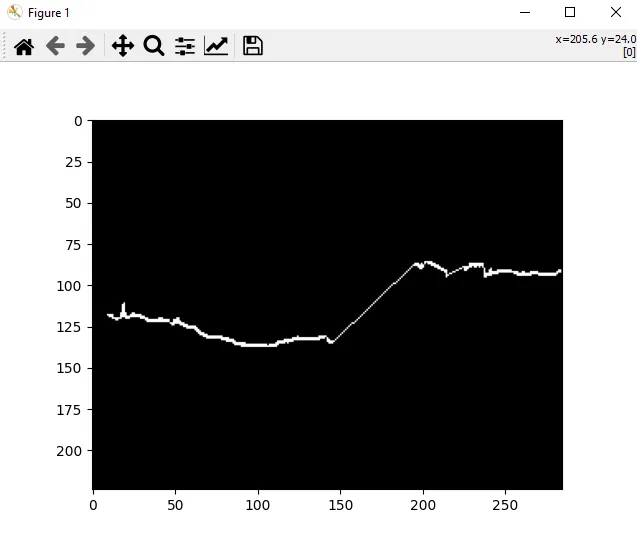
我有如下所示的图像。这是一个二进制掩码

x_idx,y_idx,并且我知道实际图像的大小,因此我首先创建了一个空数组,并利用x_idx和y_idx的帮助填充了这些线。image = np.empty((x_shape, y_shape))
def line_to_img(linedf, image):
x_idx = linedf.x
y_idx = linedf.y
for i,j in zip(x_idx, y_idx):
image[i, j] = 1
return image
你可以看到,除了左侧和右侧各有一条线外,所有像素都是相同的。
如您所见,右边的线段不连续,我想通过某些插值方法使其连续。
我尝试了两种不同的方法来实现这一点,但目前还没有成功。
第一种方法使用 skimage
new_image = skimage.morphology.remove_small_holes(old_image, 40, connectivity=2, in_place=False)
输出: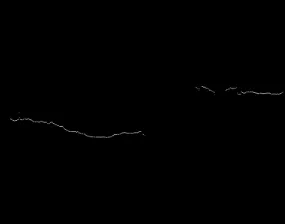
输出解释:没有进行任何插值的相同图像
第二种方法使用 cv2
kernel = cv2.getStructuringElement(cv2.MORPH_ELLIPSE,(3,3))
new_image = cv2.morphologyEx(old_image,cv2.MORPH_OPEN,kernel)
输出:
输出解释:线条由于某些原因被移除了
请帮我完成这个任务,以及如何插值图像中的线来获取连续的线条
编辑(用例):基本上,我得到了白色像素的x_idx、y_idx,并且我知道实际图像的大小,所以我首先创建一个空数组,并借助x_idx和y_idx来填充那些线条。我不能控制数据,就是这样,现在我想连接右侧的线条。基本上,我必须创建分割标签,在线条上面是一个标签,在线条下面是一个标签,左边是没问题的,我可以根据那条线将图像分成两个标签,而中间部分仍然是类1,即上部分,虽然我确定右侧是一条单行线,只是数据退化了,所以我希望这种插值出现在图片中。