我想问一下,是否有一种简单有效的方法可以将给定的字符呈现为numpy数组。我需要一个函数,它接受一个字符作为输入,并返回一个numpy数组,然后我可以将其用作plt.imshow()函数的参数。在互联网上找不到除了一些需要很多依赖项的解决方案之外,似乎这是一项容易的任务。
2个回答
9
ODL有一个名为text_phantom的文本幻影,可以带有一些特殊效果来实现这个功能。
如果你想要一个简化版的实现,你可以使用PIL库。具体来说,你需要决定图像大小和字体大小,然后就很容易实现了。
这将会提供例如以下内容:
如果你想要一个简化版的实现,你可以使用PIL库。具体来说,你需要决定图像大小和字体大小,然后就很容易实现了。
from PIL import Image, ImageDraw, ImageFont
import numpy as np

def text_phantom(text, size):
    # Availability is platform dependent
    font = 'arial'

    # Create font
    pil_font = ImageFont.truetype(font + ".ttf", size=size // len(text),
                                  encoding="unic")
    text_width, text_height = pil_font.getsize(text)

    # create a blank canvas with extra space between lines
    canvas = Image.new('RGB', [size, size], (255, 255, 255))

    # draw the text onto the canvas
    draw = ImageDraw.Draw(canvas)
    offset = ((size - text_width) // 2,
              (size - text_height) // 2)
    white = "#000000"
    draw.text(offset, text, font=pil_font, fill=white)

    # Convert the canvas into an array with values in [0, 1]
    return (255 - np.asarray(canvas)) / 255.0
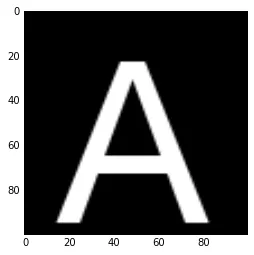
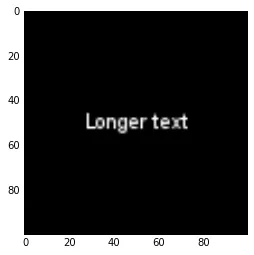
这将会提供例如以下内容:
import matplotlib.pyplot as plt
plt.imshow(text_phantom('A', 100))
plt.imshow(text_phantom('Longer text', 100))
- Jonas Adler
2
可以工作,只是有一个小错别字:第一个测试字母应该是
plt.imshow(text_phantom('A', 100)),因为 size 不是一个数组。 - Felix这并没有真正回答问题。它展示了如何写入画布,然后将画布转换为数组。但是如何写入现有的数组呢?我猜可以使用
numpy.where从画布上复制文本。但在这种情况下,抗锯齿将无法工作。 - John Henckel5
我实现了自己的绘图函数,称为
要使用下一个代码,请安装一次pip模块
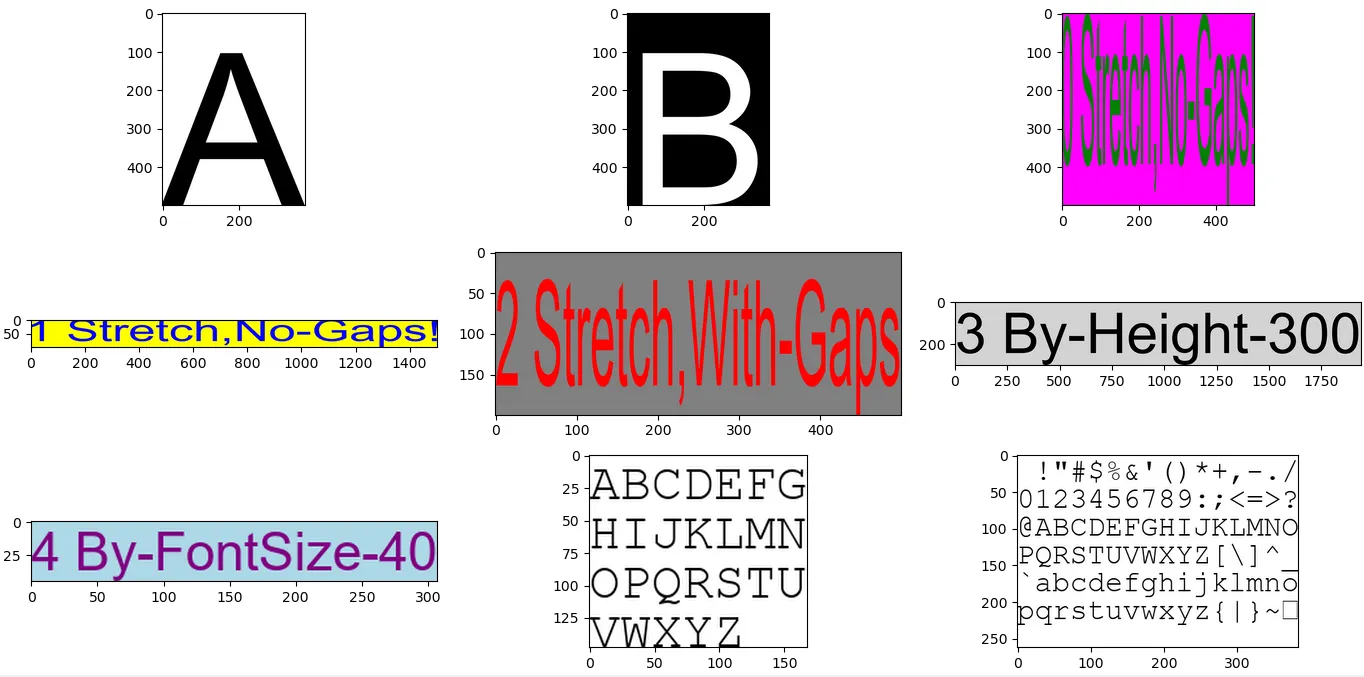
使用/测试示例请见代码末尾,在我的函数右侧。在代码之后,还有一个绘制不同字母/文本的不同颜色、字体大小、宽度/高度和拉伸的示例。
绘制一个或多个字母的最简单用法是
该函数接受以下参数:
text_draw_np(...),它可以使用PIL库将任何文本(不仅限于单个字母,甚至允许多行)绘制到numpy RGB数组中。它支持文本的着色和拉伸(更改宽高比),还支持可选的间隙(去除文本周围的空白)功能。要使用下一个代码,请安装一次pip模块
python -m pip install pillow numpy matplotlib,这里matplotlib不是绘图函数本身所必需的,它只用于测试。使用/测试示例请见代码末尾,在我的函数右侧。在代码之后,还有一个绘制不同字母/文本的不同颜色、字体大小、宽度/高度和拉伸的示例。
绘制一个或多个字母的最简单用法是
result_numpy_array = text_draw_np('ABC', height = 200),这里生成的图像高度为200像素。该函数接受以下参数:
text- Python字符串,可以是一个字母或多个字母,甚至可以是多行(包含'\n'字母以分割行)。font- 字体文件名或路径(字符串),指向包含字体的文件。字体可以是任何TrueType字体,默认情况下,我使用默认的Windows字体Arial从路径c:/windows/fonts/arial.ttf,在Linux/MacOS上,您应该更正此路径,也可以从互联网下载一些免费的TrueType字体,例如从这里。还支持其他格式,所有支持的格式都由FreeType库支持,但需要对代码PIL.ImageFont.truetype(...)进行单行修改。fontsize- 要使用的字体大小,大小以特定于给定字体文件的单位表示。您只能指定fontsize或width/height中的一个。width/height- 以像素为单位指定,如果同时指定,则绘制的文本将被拉伸以填充给定的宽度/高度。如果只指定其中之一(另一个为None),则另一个将自动计算以保持纵横比,并且文本将不被拉伸。remove_gaps- 如果此参数为True,则将删除文本周围的额外空格(背景)。大多数字体都有额外的空格,例如小写字母m在顶部有更多的空格,大写字母T的空格较少。这个空格是必要的,以便所有字母具有相同的高度,也需要为多行文本留出一些行之间的空间。如果remove_gaps是False(默认值),则保留由字体字形给出的空格量。color- 前景色(默认为'black'),bg- 背景色(默认为'white''),两者都可以是常见的颜色字符串名称,如'red'/'green'/'blue',或RGB元组,如(0, 255, 0)表示绿色。
def text_draw_np(text, *, width = None, height = None, fontsize = None, font = 'c:/windows/fonts/arial.ttf', bg = (255, 255, 255), color = (0, 0, 0), remove_gaps = False, cache = {}):
    import math, numpy as np, PIL.Image, PIL.ImageDraw, PIL.ImageFont, PIL.ImageColor
    def get_font(fname, size):
        key = ('font', fname, size)
        if key not in cache:
            cache[key] = PIL.ImageFont.truetype(fname, size = size, encoding = 'unic')
        return cache[key]
    def text_size(text, font):
        if 'tsd' not in cache:
            cache['tsi'] = PIL.Image.new('RGB', (1, 1))
            cache['tsd'] = PIL.ImageDraw.Draw(cache['tsi'])
        return cache['tsd'].textsize(text, font)
    if fontsize is not None:
        pil_font = get_font(font, fontsize)
        text_width, text_height = text_size(text, pil_font)
        width, height = text_width, text_height
    else:
        pil_font = get_font(font, 24)
        text_width, text_height = text_size(text, pil_font)
        assert width is not None or height is not None, (width, height)
        width, height = math.ceil(width) if width is not None else None, math.ceil(height) if height is not None else None
        pil_font = get_font(font, math.ceil(1.2 * 24 * max(
            ([width / text_width] if width is not None else []) +
            ([height / text_height] if height is not None else [])
        )))
        text_width, text_height = text_size(text, pil_font)
        if width is None:
            width = math.ceil(height * text_width / text_height)
        if height is None:
            height = math.ceil(width * text_height / text_width)
    canvas = PIL.Image.new('RGB', (text_width, text_height), bg)
    draw = PIL.ImageDraw.Draw(canvas)
    draw.text((0, 0), text, font = pil_font, fill = color)
    if remove_gaps:
        a = np.asarray(canvas)
        bg_rgb = PIL.ImageColor.getrgb(bg)
        b = np.zeros_like(a)
        b[:, :, 0] = bg_rgb[0]; b[:, :, 1] = bg_rgb[1]; b[:, :, 2] = bg_rgb[2]
        t0 = np.any((a != b).reshape(a.shape[0], -1), axis = -1)
        top, bot = np.flatnonzero(t0)[0], np.flatnonzero(t0)[-1]
        t0 = np.any((a != b).transpose(1, 0, 2).reshape(a.shape[1], -1), axis = -1)
        lef, rig = np.flatnonzero(t0)[0], np.flatnonzero(t0)[-1]
        a = a[top : bot, lef : rig]
        canvas = PIL.Image.fromarray(a)
    canvas = canvas.resize((width, height), PIL.Image.LANCZOS)
    return np.asarray(canvas)

import matplotlib.pyplot as plt, matplotlib
fig, axs = plt.subplots(3, 3, constrained_layout = True)
axs[0, 0].imshow(text_draw_np('A', height = 500), interpolation = 'lanczos')
axs[0, 1].imshow(text_draw_np('B', height = 500, color = 'white', bg = 'black'), interpolation = 'lanczos')
axs[0, 2].imshow(text_draw_np('0 Stretch,No-Gaps!', width = 500, height = 500, color = 'green', bg = 'magenta', remove_gaps = True), interpolation = 'lanczos')
axs[1, 0].imshow(text_draw_np('1 Stretch,No-Gaps!', width = 1500, height = 100, color = 'blue', bg = 'yellow', remove_gaps = True), interpolation = 'lanczos')
axs[1, 1].imshow(text_draw_np('2 Stretch,With-Gaps', width = 500, height = 200, color = 'red', bg = 'gray'), interpolation = 'lanczos')
axs[1, 2].imshow(text_draw_np('3 By-Height-300', height = 300, color = 'black', bg = 'lightgray'), interpolation = 'lanczos')
axs[2, 0].imshow(text_draw_np('4 By-FontSize-40', fontsize = 40, color = 'purple', bg = 'lightblue'), interpolation = 'lanczos')
axs[2, 1].imshow(text_draw_np(''.join([(chr(i) + ('' if (j + 1) % 7 != 0 else '\n')) for j, i in enumerate(range(ord('A'), ord('Z') + 1))]),
    fontsize = 40, font = 'c:/windows/fonts/cour.ttf'), interpolation = 'lanczos')
axs[2, 2].imshow(text_draw_np(''.join([(chr(i) + ('' if (j + 1) % 16 != 0 else '\n')) for j, i in enumerate(range(32, 128))]),
    fontsize = 40, font = 'c:/windows/fonts/cour.ttf'), interpolation = 'lanczos')
#plt.tight_layout(pad = 0.05, w_pad = 0.05, h_pad = 0.05)
plt.show()
输出:
- Arty
网页内容由stack overflow 提供, 点击上面的可以查看英文原文,
原文链接
原文链接
scikit-image将它们转换为二进制(阈值化),然后你就会自动得到你的numpy数组。 - Adam Hughes