很多年前,工程师使用一种负10进制对数的横线符号(横线覆盖数字特征)来表示。在ggplot2中有办法使用这种符号吗?如果没有,我如何使用Unicode创建自定义断点,例如 "\bar{2}.07918" 或类似的内容?
1个回答
4
您可以使用 labels 参数将每个标签转换为绘图表达式。如果我理解正确,您正在寻找数字的指数-尾数表示法,就像在滑动尺和对数表使用的那样,其中负指数的值由数字上方的条形表示。这需要一个小函数来生成标签:
bar_notation <- function(x) {
  mantissa <- log10(x) - floor(log10(x))
  exponent <- floor(log10(x))
  e <- ifelse(exponent < 0, paste0("bar(", -exponent, ")"), paste(exponent))
  m <- ifelse(mantissa == 0, "000", substr(as.character(mantissa), 3, 6))
  parse(text = paste(e, "*.*", m))
}
我们可以直接将此函数传递给
scale_y_log10 的labels参数。为了演示目的,让我们使用e的幂作为轴上的分隔点:library(ggplot2)
ggplot(df, aes(x, y)) +
geom_boxplot(fill = "lightblue") +
scale_y_log10(labels = bar_notation, breaks = exp(seq(-4, 4))) +
theme_minimal(base_size = 16)
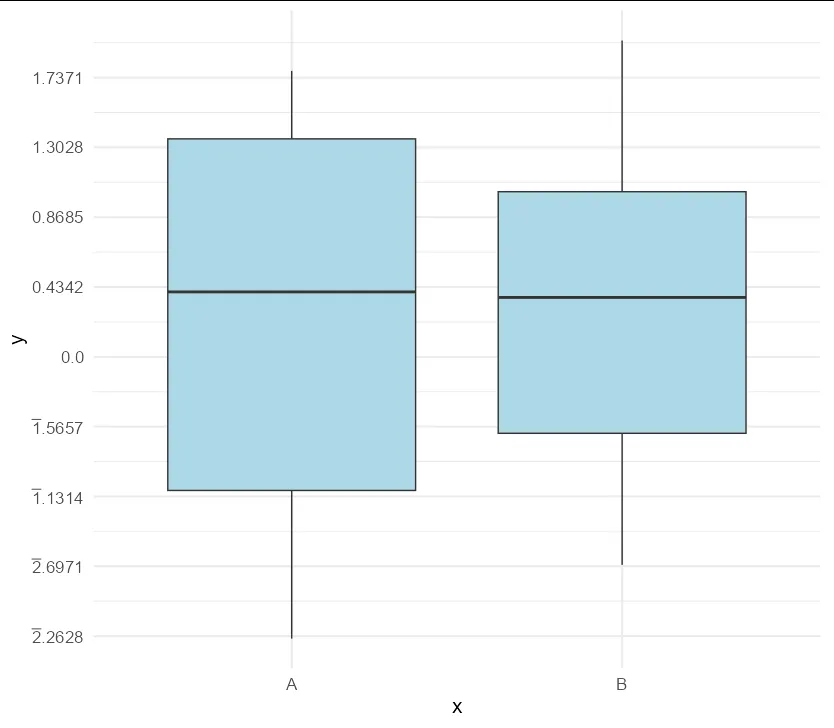
为了解释这些数字,我们只需将小数点两侧的值相加(负值用横线表示)。例如, 我们可以看到在图中y的最低值略低于横线(2).2628。为了找出这个数字代表什么,我们可以进行计算-2 + 0.2628 = -1.7372。这意味着y轴上的值是10^-1.7372或0.01831471。我们可以确认y的最低值略低于此值:
min(df$y)
#> [1] 0.01766628
使用的数据
set.seed(1)

df <- data.frame(x = rep(c("A", "B"), each = 10), y = 10^runif(20, -2, 2))
- Allan Cameron
1
谢谢!条形符号使用特征和尾数,但我认为我可以弄清楚其余部分。我只是不知道如何在ggplot中显示条形符号。 - Mercurial
网页内容由stack overflow 提供, 点击上面的可以查看英文原文,
原文链接
原文链接