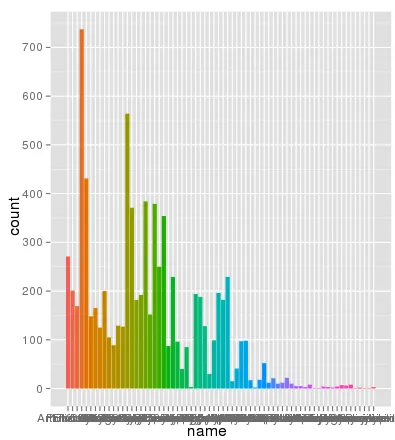
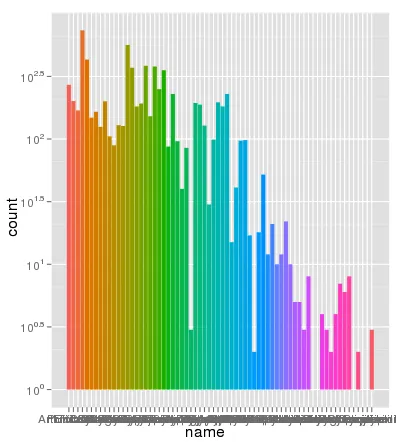
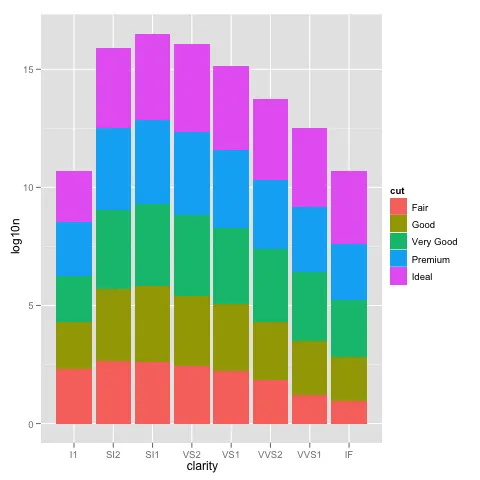
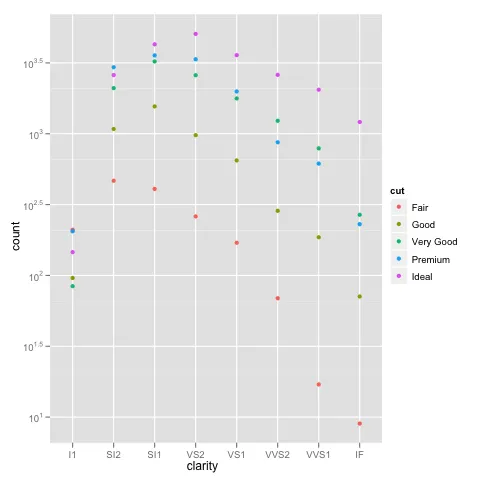
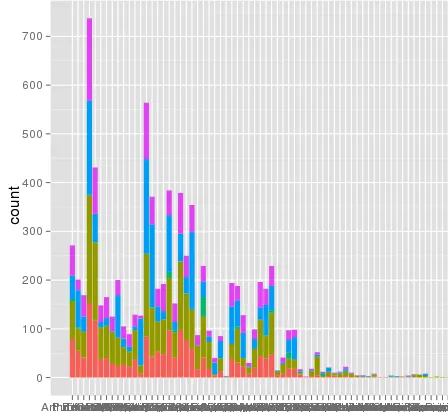
我在使用ggplot进行缩放时遇到了一个有趣的问题。我的数据集在使用默认线性比例尺时可以很好地绘制图形,但是当我使用scale_y_log10()时,数字就会偏离轨道。以下是一些示例代码和两张图片。请注意,在线性比例尺中的最大值约为700,而对数缩放结果为10 ^ 8。我向您展示,整个数据集仅约为8000项,因此某些地方不正确。
我想象这个问题与我的数据集结构和分箱有关,因为我无法在像“钻石”这样的常见数据集上复制此错误。然而,我不确定要解决问题的最佳方法。
谢谢, zach cp
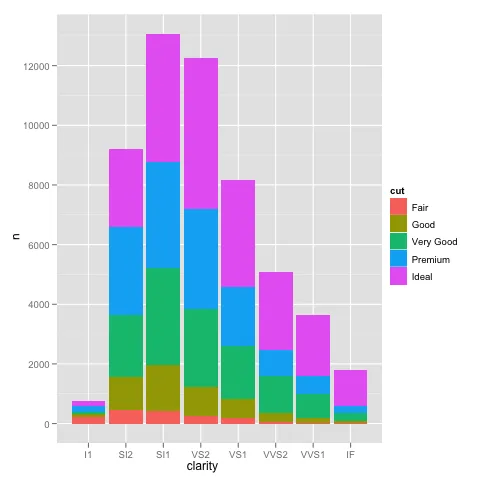
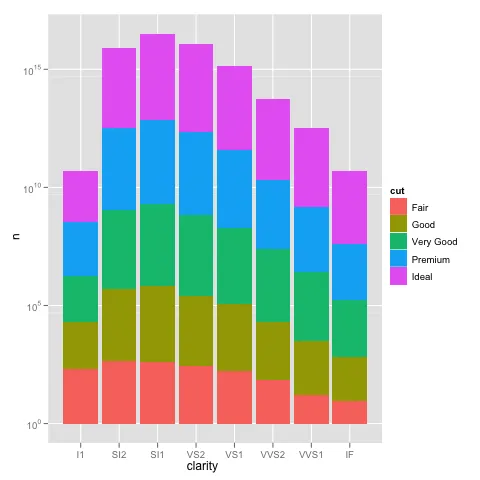
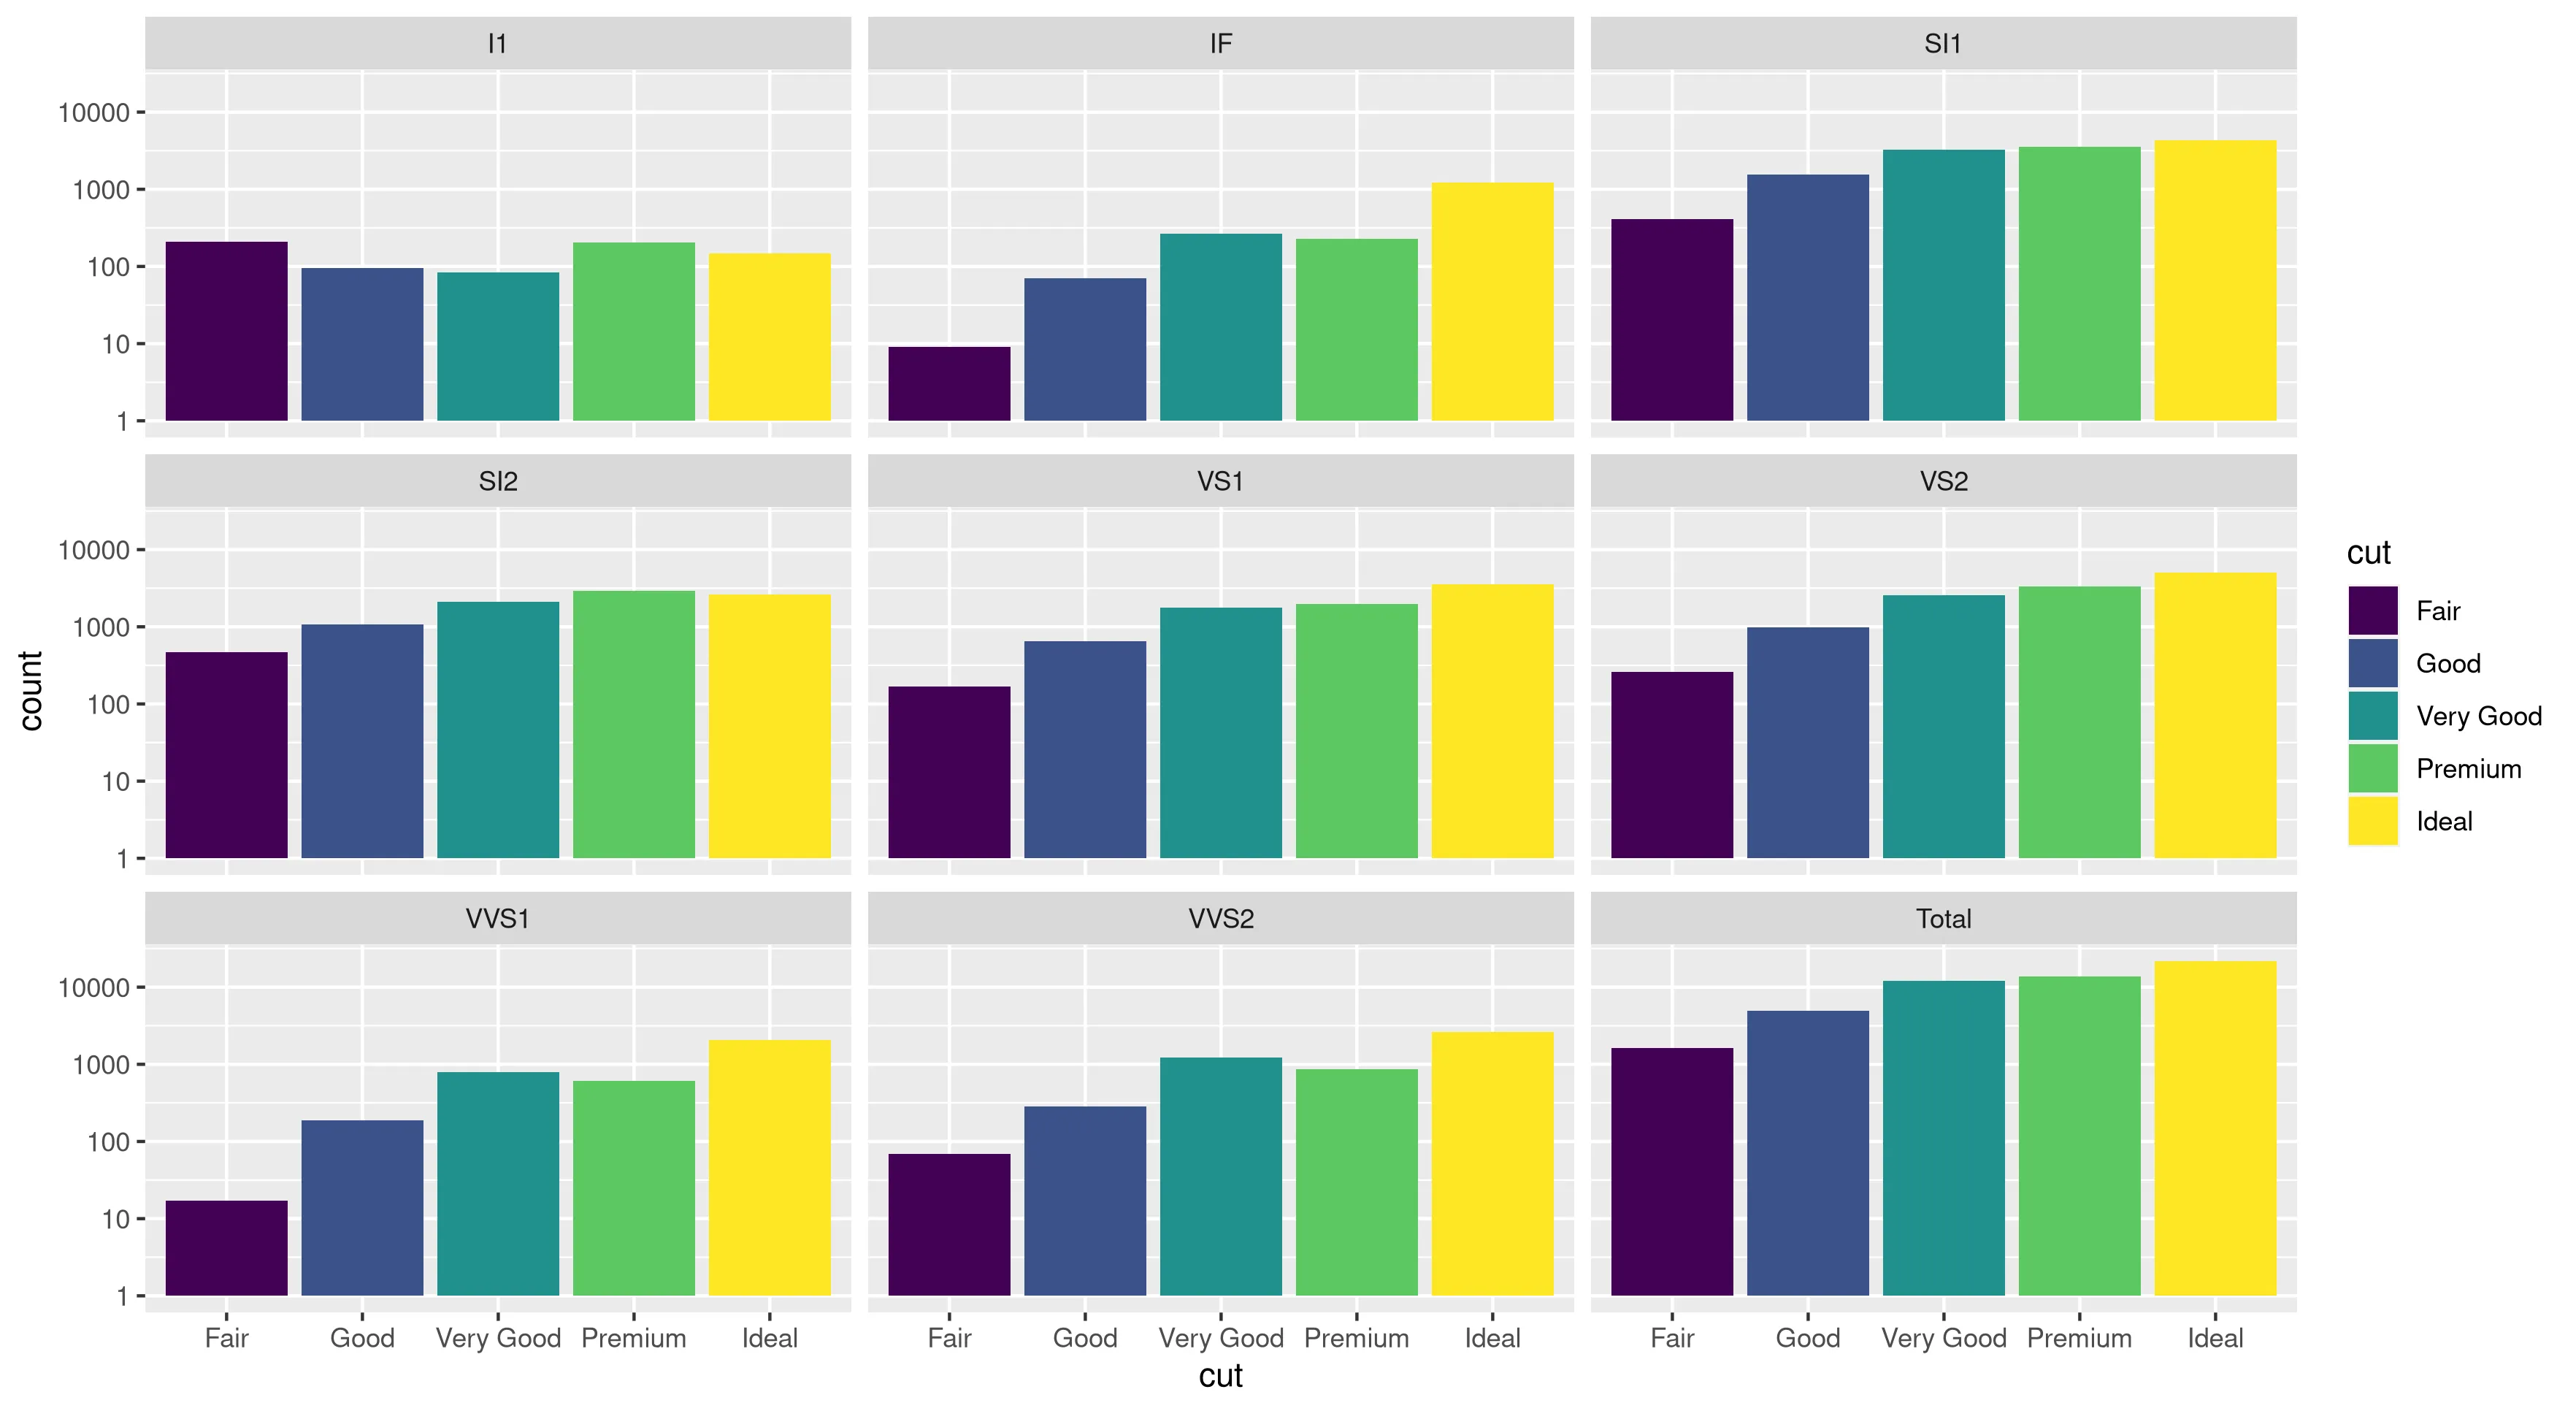
编辑:bdamarest可以通过以下方式在钻石数据集上重现比例问题:
example_1 = ggplot(diamonds, aes(x=clarity, fill=cut)) +
  geom_bar() + scale_y_log10(); print(example_1)
#data.melt is the name of my dataset
> ggplot(data.melt, aes(name, fill= Library)) + geom_bar()
> ggplot(data.melt, aes(name, fill= Library)) + geom_bar()  + scale_y_log10()
> length(data.melt$name)
[1] 8003
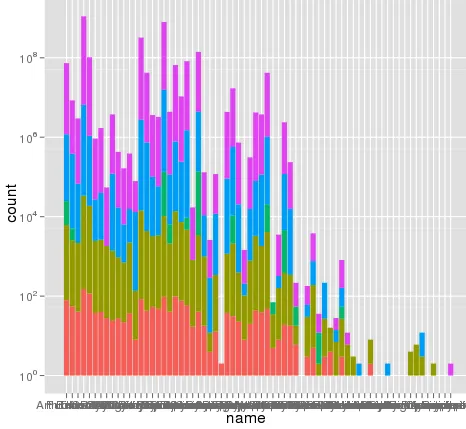
这里有一些示例数据...我认为我看到了问题所在。原始的融合数据集可能有大约10^8行。也许行号被用于统计数据?
> head(data.melt)
       Library         name               group
221938      AB Arthrofactin        glycopeptide
235087      AB   Putisolvin      cyclic peptide
235090      AB   Putisolvin      cyclic peptide
222125      AB Arthrofactin        glycopeptide
311468      AB     Triostin cyclic depsipeptide
92249       AB          CDA         lipopeptide
test2 <- data.frame(
  Library = rep("AB", 6L),
  name = c(
    "Arthrofactin", "Putisolvin", "Putisolvin", "Arthrofactin",
    "Triostin", "CDA"
  ),
  group = c(
    "glycopeptide", "cyclic peptide", "cyclic peptide", "glycopeptide",
    "cyclic depsipeptide", "lipopeptide"
  ),
  row.names = c(221938L, 235087L, 235090L, 222125L, 311468L, 92249L)
)
更新:
行号不是问题。这里使用相同的 aes x 轴和填充颜色绘制了相同的数据图,缩放完全正确:
> ggplot(data.melt, aes(name, fill= name)) + geom_bar()
> ggplot(data.melt, aes(name, fill= name)) + geom_bar() + scale_y_log10()
> length(data.melt$name)
[1] 8003