在坐标轴上显示小数位和科学计数法

35
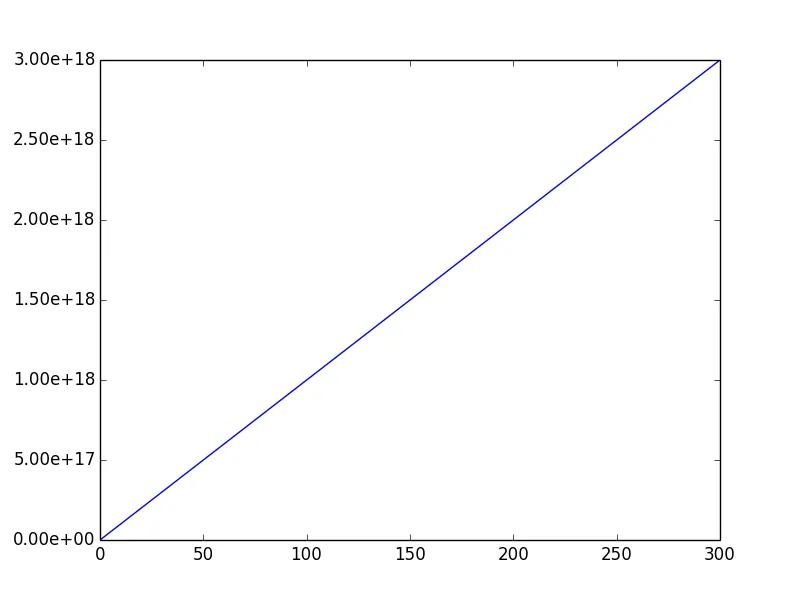
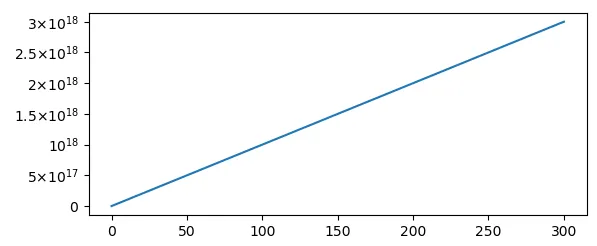
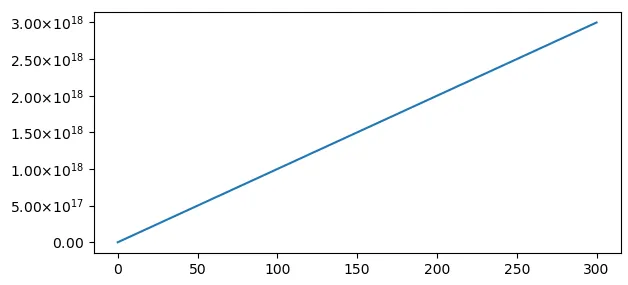
我正在使用Python 2.7在PyQt程序中使用matplotlib绘制一些大数字。我的y轴范围从1e+18到3e+18(通常情况下)。我希望每个刻度线都显示科学计数法和2位小数。例如,应该显示2.35e+18而不是仅显示2e+18,因为在2e+18和3e+18之间的值仍然只读取几个刻度线的2e+18。以下是该问题的示例。
import numpy as np
import matplotlib.pyplot as plt
fig = plt.figure()
ax = fig.add_subplot(111)
x = np.linspace(0, 300, 20)
y = np.linspace(0,300, 20)
y = y*1e16
ax.plot(x,y)  
ax.get_xaxis().set_major_formatter(plt.LogFormatter(10,  labelOnlyBase=False))
ax.get_yaxis().set_major_formatter(plt.LogFormatter(10,  labelOnlyBase=False))
plt.show()

1
请问如何在Matplotlib中更改X轴的刻度? - 0 _
同样的问题:https://dev59.com/eV4c5IYBdhLWcg3wD2nC - cardamom
3个回答

67

如果你使用 matplotlib.ticker.FormatStrFormatter 而不是 LogFormatter,这就非常容易实现了。以下代码将会以格式 '%.2e' 标记所有内容:

import numpy as np
import matplotlib.pyplot as plt
import matplotlib.ticker as mtick

fig = plt.figure()

ax = fig.add_subplot(111)

x = np.linspace(0, 300, 20)

y = np.linspace(0,300, 20)
y = y*1e16

ax.plot(x,y)

ax.yaxis.set_major_formatter(mtick.FormatStrFormatter('%.2e'))

plt.show()

示例绘图


1
有没有办法在小于e^10的情况下更改e的指数位数? - Herpes Free Engineer
我的图表中出现了'matplotlib.pyplot' has no attribute 'yaxis'的错误。通过在设置主要格式化程序时添加对.gca()的调用来解决,即plt.gca().yaxis.set_major_formatter(...) - alelom

23
为了以科学计数法的方式获得漂亮格式的标签,可以使用 ScalarFormatter 的格式化功能,该功能使用 MathText (Latex) 并将其应用于标签。
import matplotlib.pyplot as plt
import numpy as np
import matplotlib.ticker as mticker

fig, ax = plt.subplots()

x = np.linspace(0, 300, 20)
y = np.linspace(0,300, 20)
y = y*1e16

ax.plot(x,y)

f = mticker.ScalarFormatter(useOffset=False, useMathText=True)
g = lambda x,pos : "${}$".format(f._formatSciNotation('%1.10e' % x))
plt.gca().yaxis.set_major_formatter(mticker.FuncFormatter(g))

plt.show()

在此输入图片描述

虽然这种方法在许多情况下可能很有用,但它实际上并不满足问题的要求。要达到所有标签上的数字相等,可以使用更定制化的版本。

import matplotlib.pyplot as plt
import numpy as np
import matplotlib.ticker as mticker

fig, ax = plt.subplots()

x = np.linspace(0, 300, 20)
y = np.linspace(0,300, 20)
y = y*1e16

ax.plot(x,y)

class MathTextSciFormatter(mticker.Formatter):
    def __init__(self, fmt="%1.2e"):
        self.fmt = fmt
    def __call__(self, x, pos=None):
        s = self.fmt % x
        decimal_point = '.'
        positive_sign = '+'
        tup = s.split('e')
        significand = tup[0].rstrip(decimal_point)
        sign = tup[1][0].replace(positive_sign, '')
        exponent = tup[1][1:].lstrip('0')
        if exponent:
            exponent = '10^{%s%s}' % (sign, exponent)
        if significand and exponent:
            s =  r'%s{\times}%s' % (significand, exponent)
        else:
            s =  r'%s%s' % (significand, exponent)
        return "${}$".format(s)

# Format with 2 decimal places
plt.gca().yaxis.set_major_formatter(MathTextSciFormatter("%1.2e"))

plt.show()

这里输入图片描述


能否将该值转换为二进制? - Number1
2
是的,它可以,但这超出了这个问题的范围。 - ImportanceOfBeingErnest
谢谢这门课程,非常有帮助。 - Lone Wolf
这个答案的第二部分是有效的,但是第一部分使用 f._formatSciNotation 的方法不起作用,因为 _formatSciNotation 不再是一个有效的方法。 - undefined

1

自从最近重新安装电脑后,@ImportanceOfBeingEmest的ScalarFormatter_formatSciNotation方法不再起作用。我收到以下错误消息。

g = lambda x,pos : "${}$".format(f._formatSciNotation('%1.10e' % x))
AttributeError: 'ScalarFormatter'对象没有属性'_formatSciNotation'

根据以下答案的建议,我使用LogFormatterSciNotation实现了我的需求。 https://dev59.com/usv6oIgBc1ULPQZFucbA#74403178

示例:

 from matplotlib.ticker import LogFormatterSciNotation
 plt.gca().set_xticks([1E2,3E2,1E3,3E3,1E4,3E4,1E5])
 plt.gca().xaxis.set_major_formatter(LogFormatterSciNotation(base=10,minor_thresholds=(10,10)))

网页内容由stack overflow 提供, 点击上面的
可以查看英文原文,
原文链接