在您的情况下,实际上您想要禁用偏移量。使用科学计数法是与以偏移值显示内容的设置不同的设置。
但是,ax.ticklabel_format(useOffset=False) 应该可以工作(尽管您已将其列为未奏效的事物之一)。
例如:
fig, ax = plt.subplots()
ax.plot(range(2003,2012,1),range(200300,201200,100))
ax.ticklabel_format(useOffset=False)
plt.show()
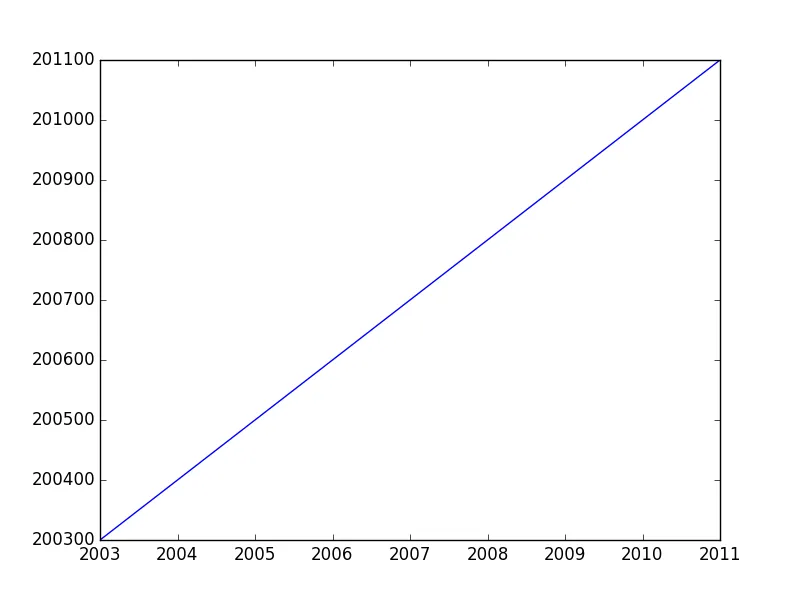
如果您想同时禁用偏移量和科学计数法,可以使用ax.ticklabel_format(useOffset=False, style='plain')。
"偏移量"和"科学计数法"之间的区别
在 Matplotlib 坐标轴格式化中,“科学计数法”是指所显示数字的乘数,而“偏移量”是一个单独的值,需要被加上。
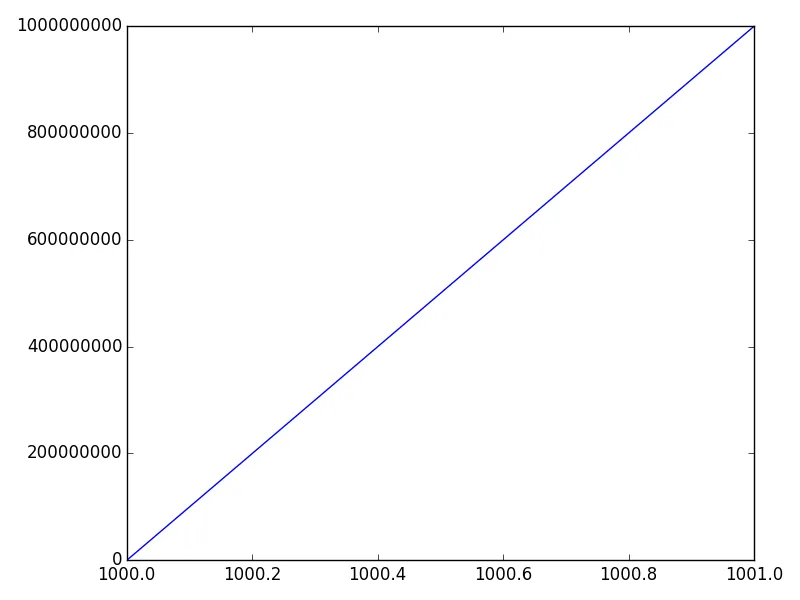
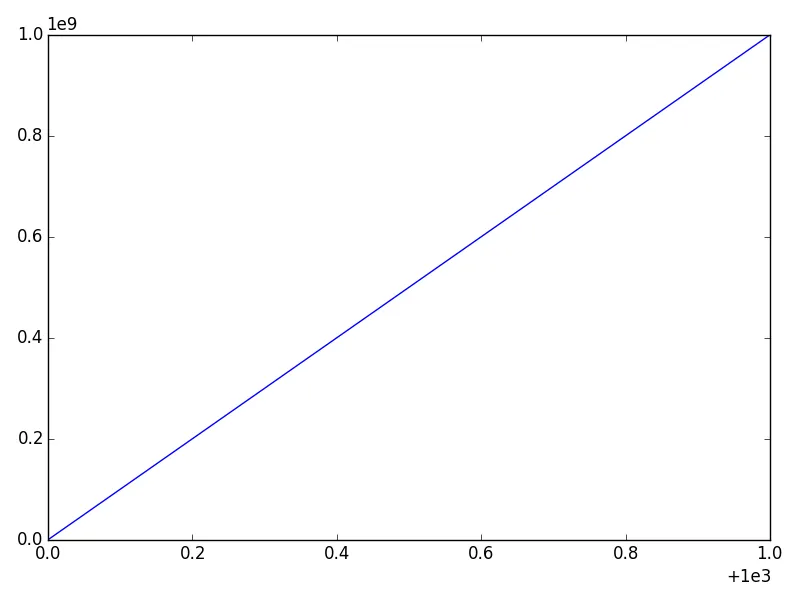
考虑下面这个例子:
import numpy as np
import matplotlib.pyplot as plt

x = np.linspace(1000, 1001, 100)
y = np.linspace(1e-9, 1e9, 100)

fig, ax = plt.subplots()
ax.plot(x, y)
plt.show()
x轴会有一个偏移量(请注意 + 符号),而y轴将使用科学计数法(作为乘数 -- 没有加号)。
我们可以分别禁用其中一个。最方便的方法是使用 ax.ticklabel_format 方法(或 plt.ticklabel_format)。
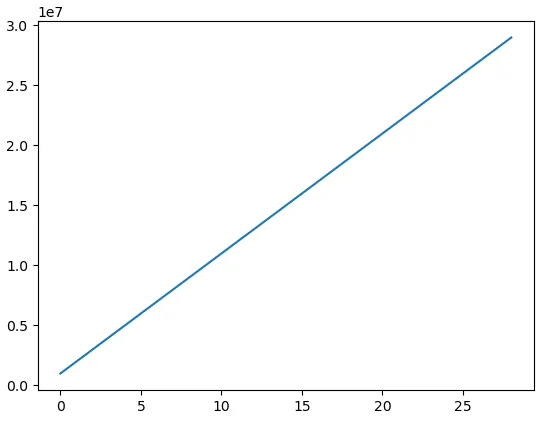
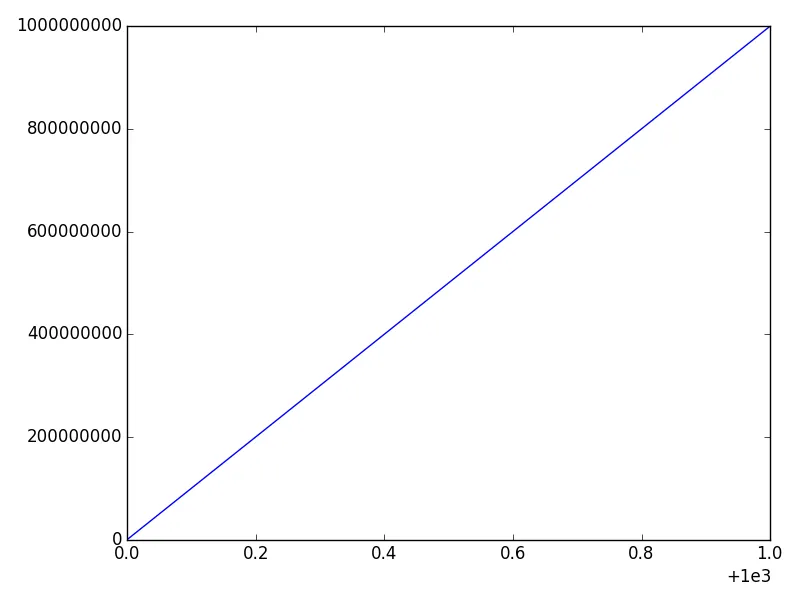
例如,如果我们调用:
ax.ticklabel_format(style='plain')
我们将禁用y轴上的科学计数法:
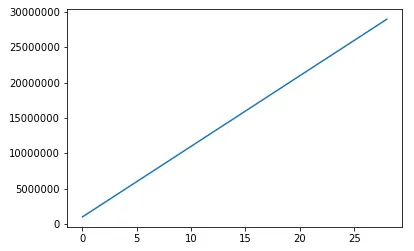
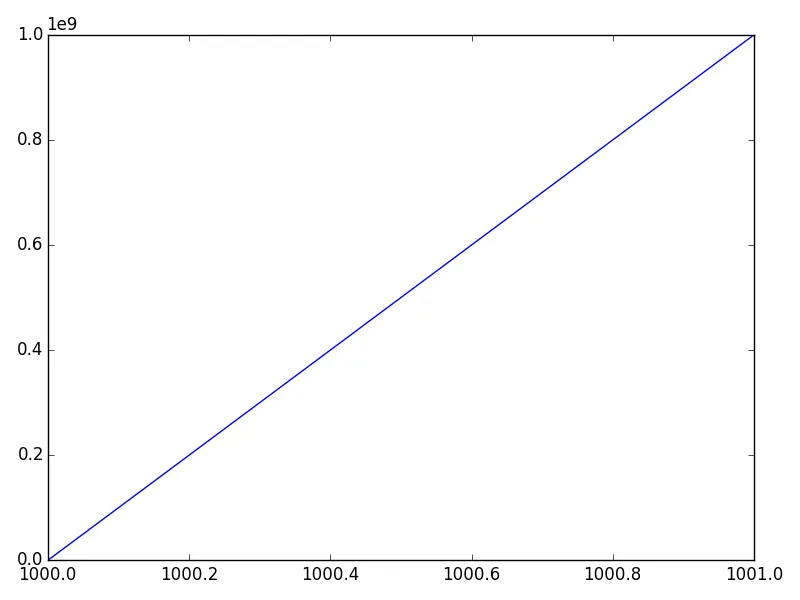
如果我们调用
ax.ticklabel_format(useOffset=False)
我们将禁用X轴上的偏移量,但保留Y轴科学计数法:
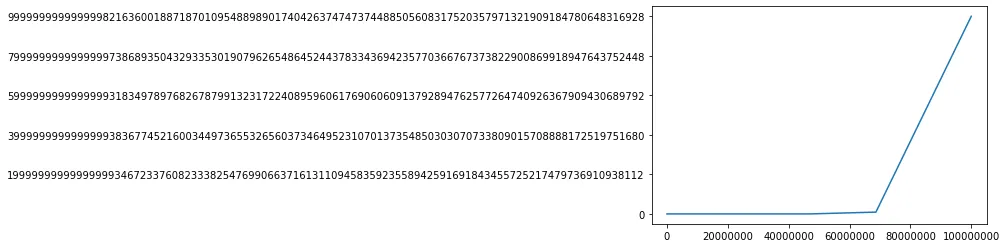
最后,我们可以通过以下方式同时禁用两者:
ax.ticklabel_format(useOffset=False, style='plain')