这个问题问了一段时间了,但我希望现在回答还不算太晚。在类似的问题中,使用分水岭分割存在一个普遍的问题。有时,对象是独立的,彼此不接触,如
这个例子。在这种情况下,仅对图像进行模糊处理就足以使用分水岭分割。有时,对象位于紧密且相互接触的位置,因此对象的边界不清晰,如
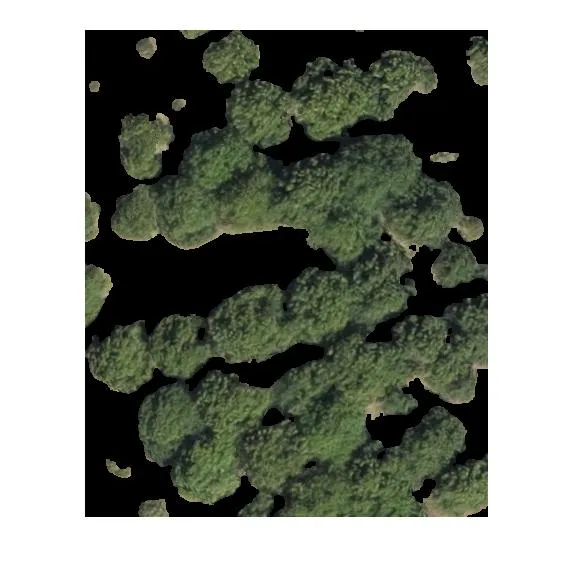
这个例子。在这种情况下,使用距离变换-> 模糊-> 分水岭有所帮助。在这个问题中,逻辑方法应该使用距离变换。然而,由于树上和附近存在阴影,边界不清晰。在这种情况下,最好使用任何有助于分离对象
的信息或强调对象本身。
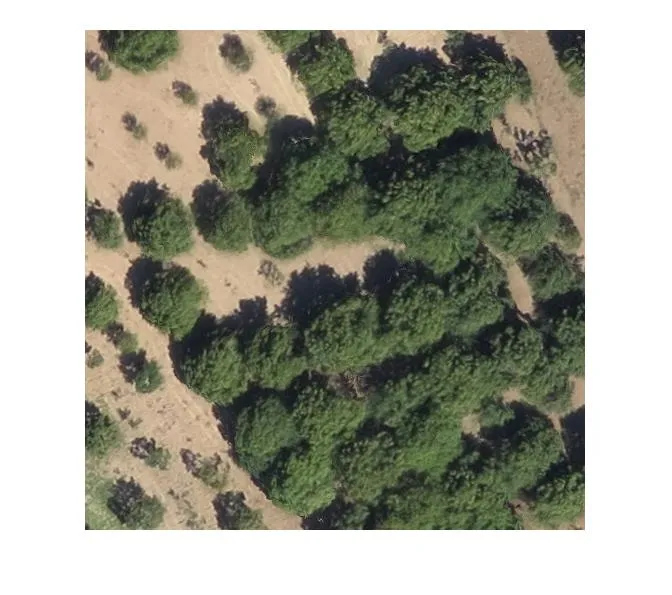
在这个问题中,我建议使用颜色信息来强调树的像素。以下是MATLAB代码和结果。
im=imread('https://istack.dev59.com/aBHUL.webp');
im=im(58:500,86:585,:);
imOrig=im;
im=double(im);
r=im(:,:,1);
g=im(:,:,2);
b=im(:,:,3);
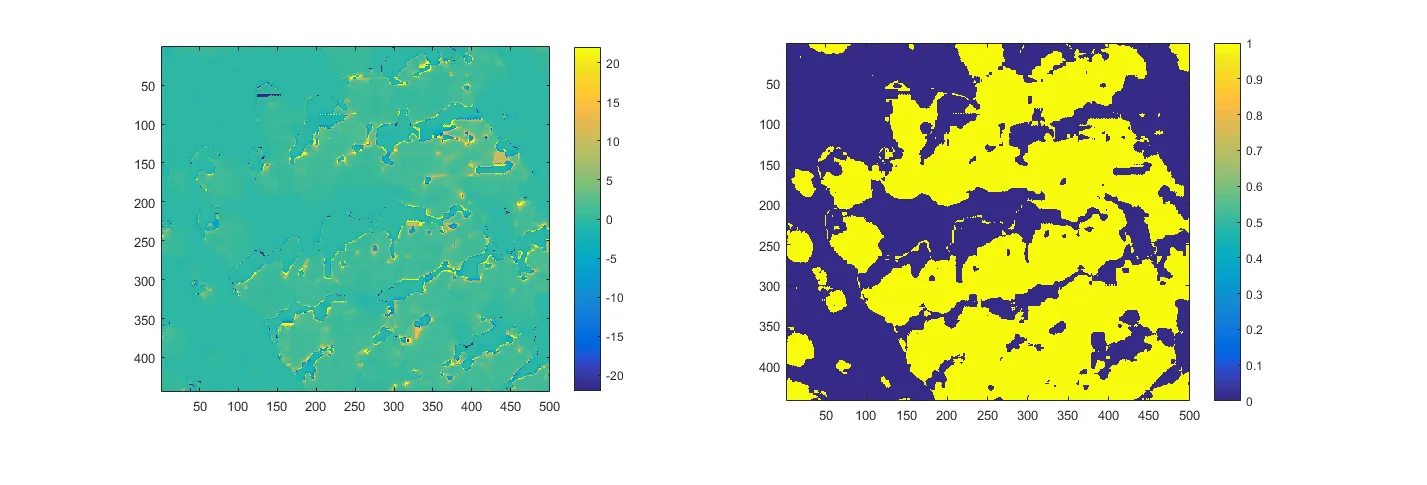
tmp=((g-r)./(r-b));
figure
subplot(121);imagesc(tmp),axis image;colorbar
subplot(122);imagesc(tmp>0),axis image;colorbar
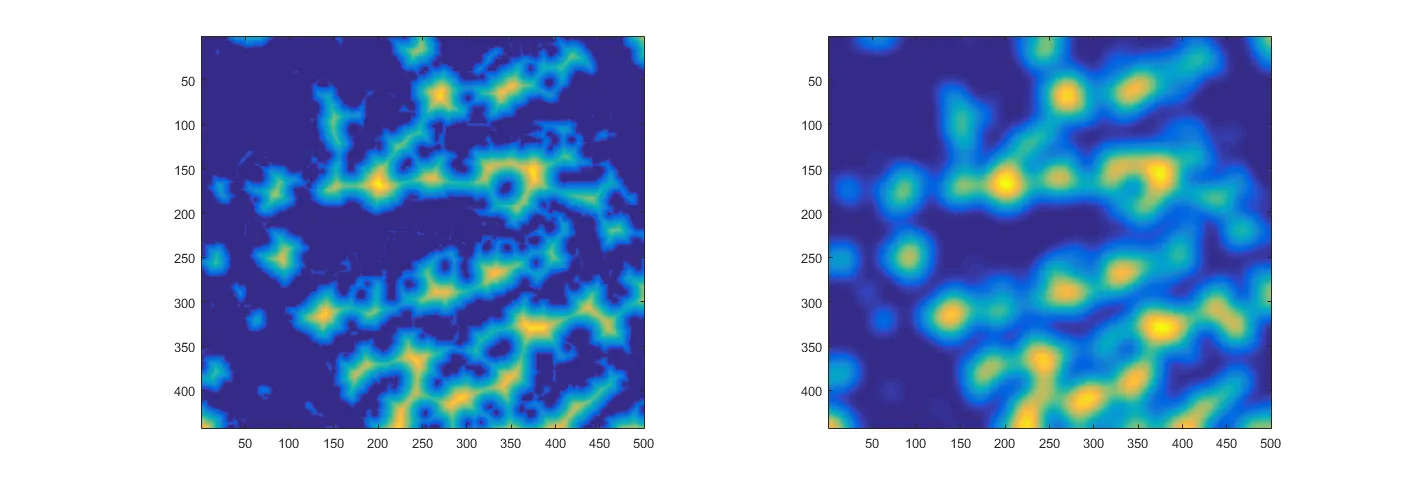
im_dist=bwdist(tmp<0);
sigma=10;
kernel = fspecial('gaussian',4*sigma+1,sigma);
im_blured=imfilter(im_dist,kernel,'symmetric');
figure
subplot(121);imagesc(im_dist),axis image;colorbar
subplot(122);imagesc(im_blured),axis image;colorbar
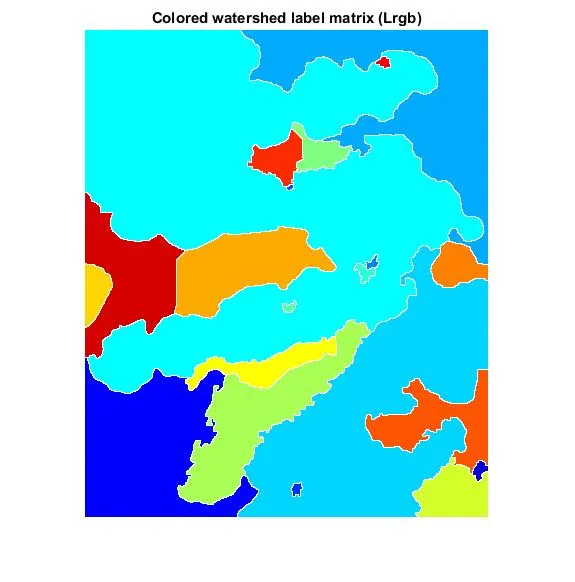
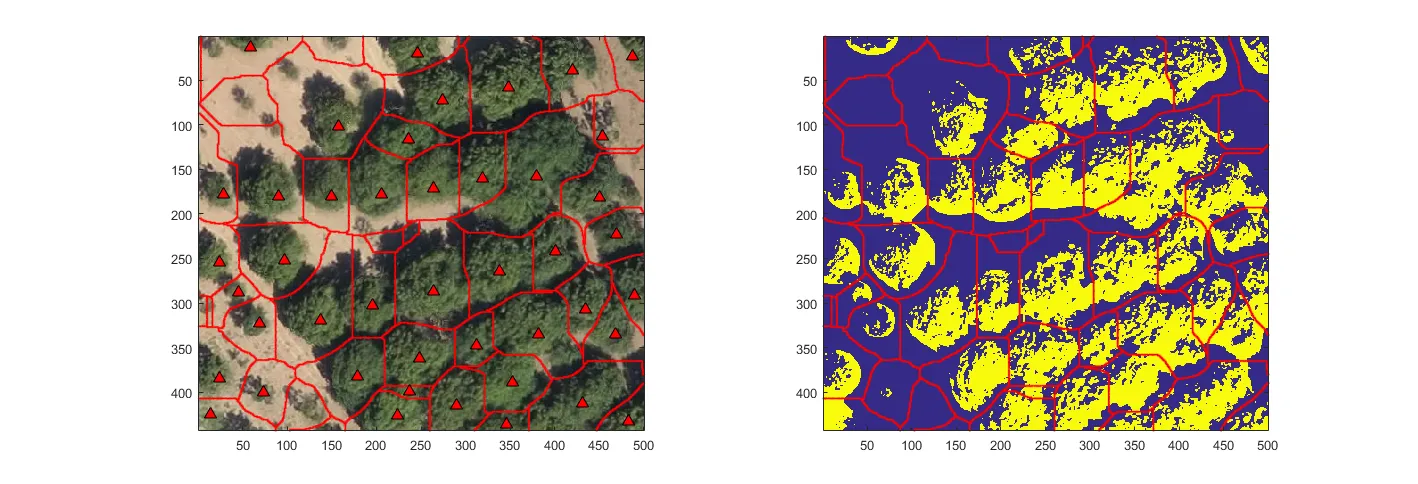
L = watershed(max(im_blured(:))-im_blured);
[x,y]=find(L==0);
figure
subplot(121);
imagesc(imOrig),axis image
hold on, plot(y,x,'r.','MarkerSize',3)
trees=zeros(size(im_dist));
centers= [];
for i=1:max(L(:))
ind=find(L==i & im_blured>1);
mask=L==i;
[thr,metric] =multithresh(g(ind),1);
trees(ind)=g(ind)>thr*1;
trees_individual=trees*0;
trees_individual(ind)=g(ind)>thr*1;
s=regionprops(trees_individual,'Centroid');
centers=[centers; cat(1,[],s.Centroid)];
end
subplot(122);
imagesc(trees),axis image
hold on, plot(y,x,'r.','MarkerSize',3)
subplot(121);
hold on, plot(centers(:,1),centers(:,2),'k^','MarkerFaceColor','r','MarkerSize',8)
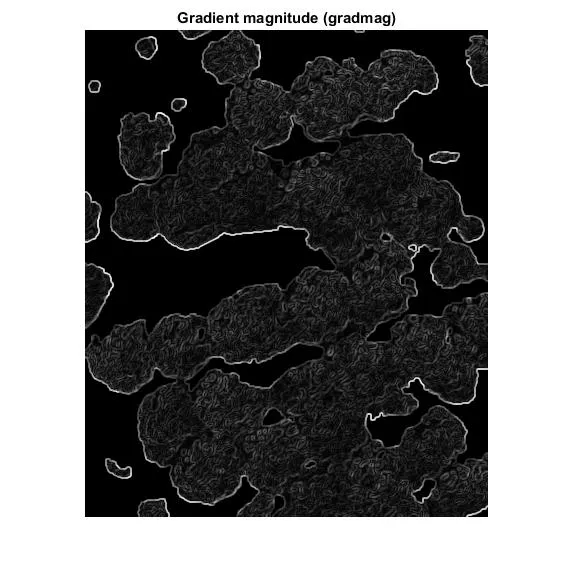
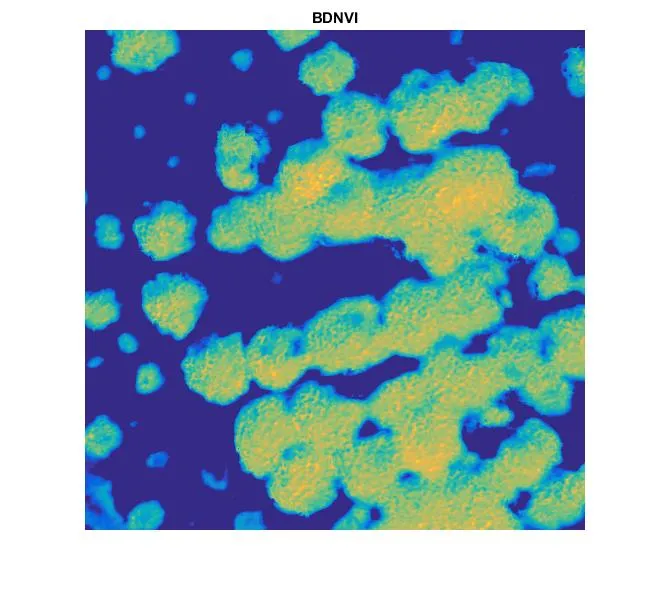
 首先,我使用蓝色NDVI去除了地面:
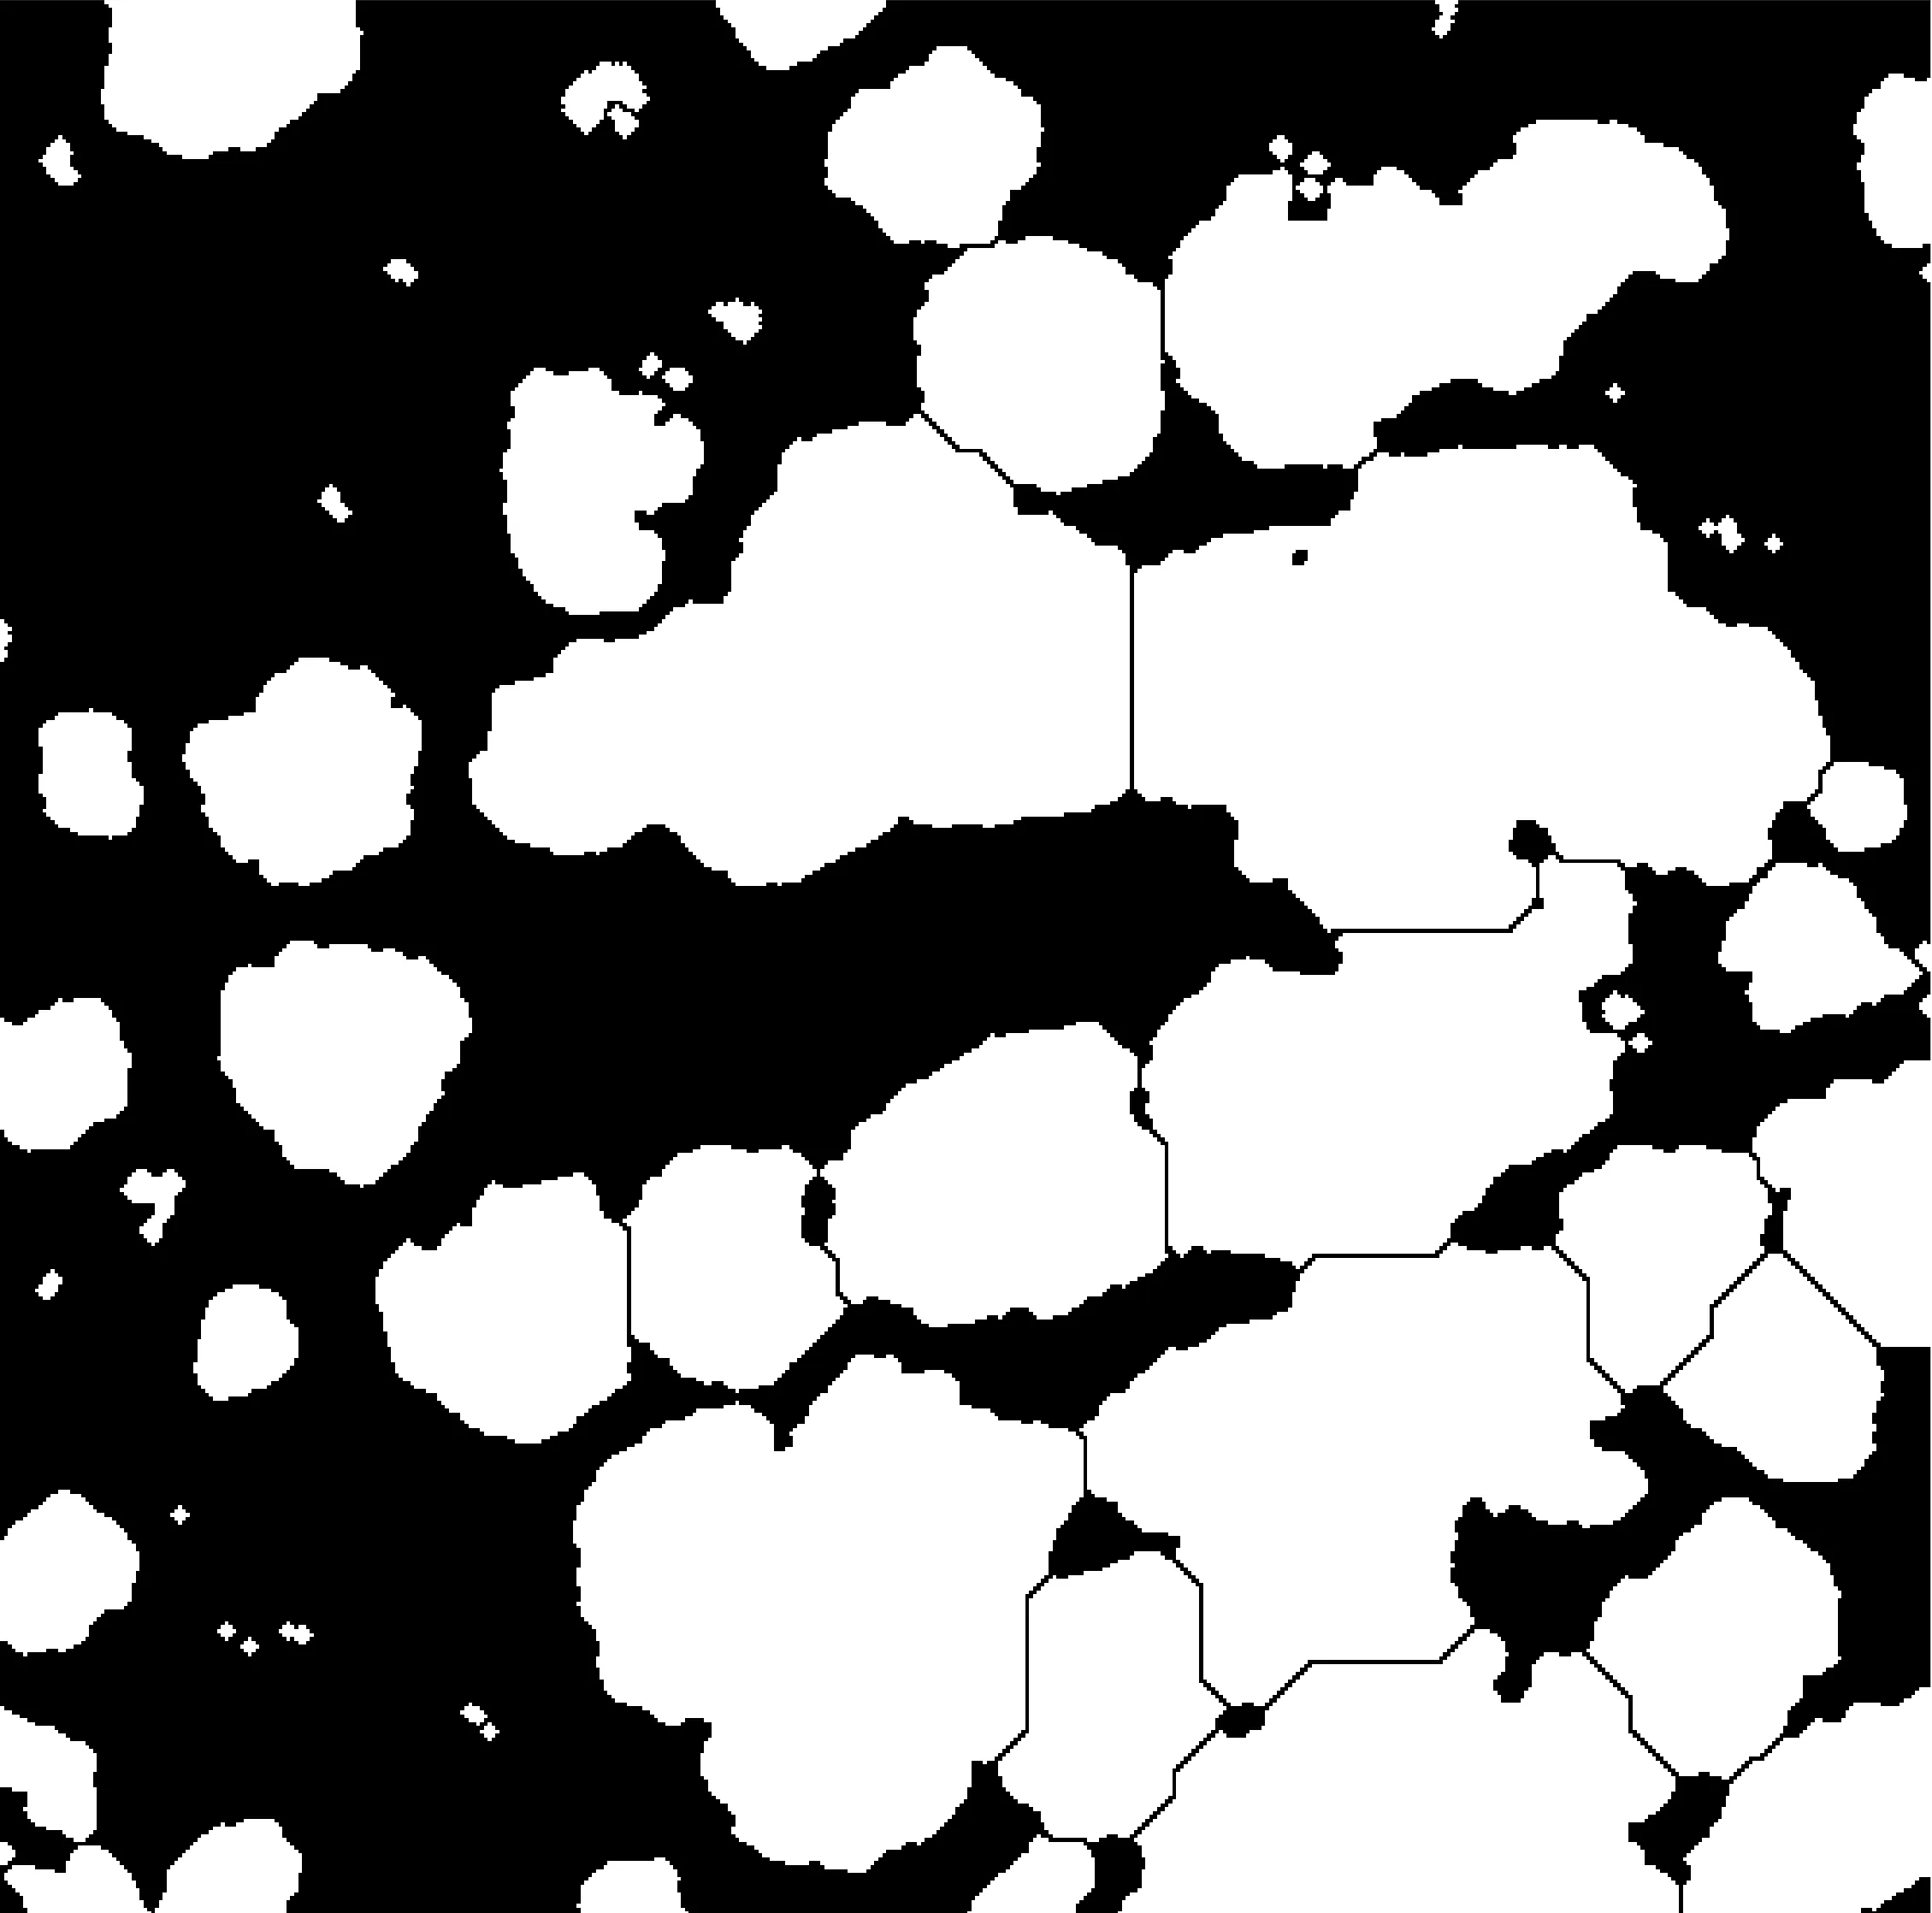
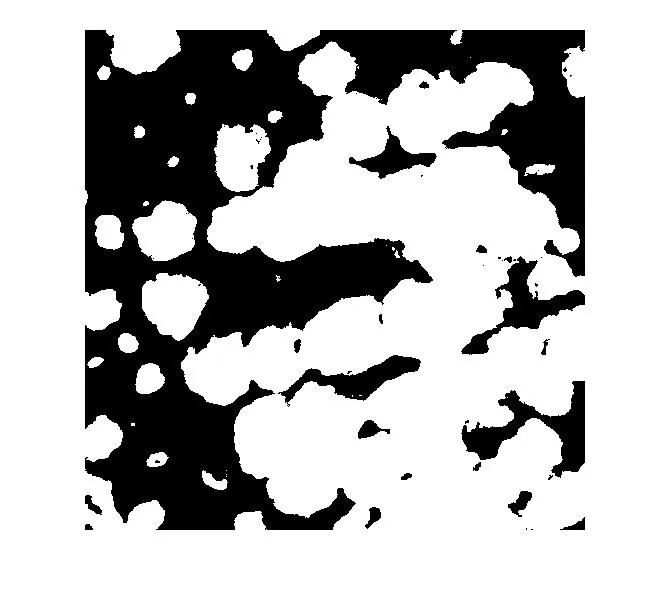
 带有阈值的图像:
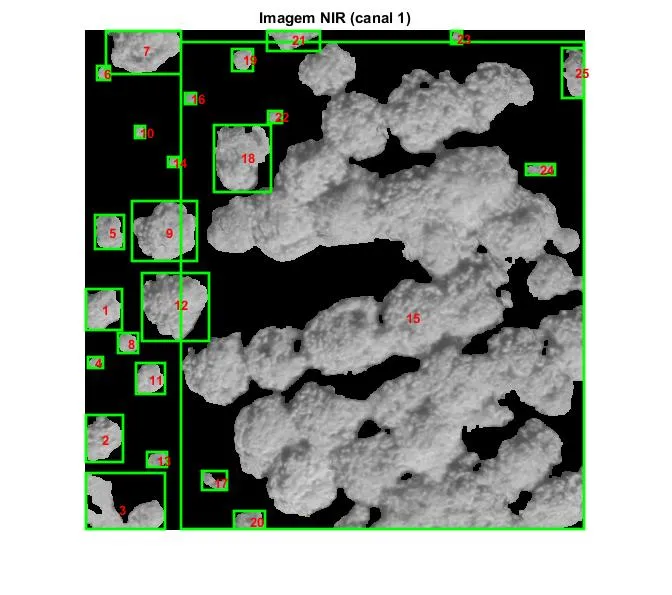
 然后,我使用regionprops函数来检测图像上的树木数量: