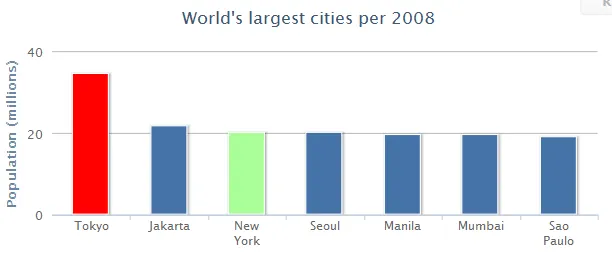
我有一个柱状图,其中包含多个类别,每个类别只有一个数据点(例如这种类型)。是否可以更改每个类别的柱形图颜色?也就是说,每个柱形图都有自己独特的颜色,而不是所有柱形图都是蓝色吗?
11个回答
116
如果你将数据数组更改为配置对象,而不是数字,则可以为每个点/条单独设置颜色。
data: [
      {y: 34.4, color: 'red'},     // this point is red
      21.8,                        // default blue
      {y: 20.1, color: '#aaff99'}, // this will be greenish
      20]                          // default blue
- eolsson
1
6正确的答案应该来自@antonversal! 自动 " {plotOptions: {column: {colorByPoint: true}}} " 魔法! - Cassiano
70
- antonversal
1
10这应该是正确的答案。手动设置每个数据系列中每个条柱的颜色是不切实际的。 - harryg
32
将您想要的颜色添加到
colors中,然后将colorByPoint设置为true。colors: [
'#4572A7',
'#AA4643',
'#89A54E',
'#80699B',
'#3D96AE',
'#DB843D',
'#92A8CD',
'#A47D7C',
'#B5CA92'
],
plotOptions: {
column: {
colorByPoint: true
}
}
参考文献:
- Ricardo Alvaro Lohmann
17
是的,这里有一个在jsfiddle上的示例:http://jsfiddle.net/bfQeJ/
Highcharts.setOptions({
    colors: ['#058DC7', '#50B432', '#ED561B', '#DDDF00', '#24CBE5', '#64E572', '#FF9655', '#FFF263', '#6AF9C4']
});
这个示例是一个饼图,但你可以随心所欲地用所有的颜色来填充系列 =)
- Allen Liu
3
1嘿,我尝试使用上面的代码,但是我的整个图形都变成了第一个颜色#058DC7,没有任何颜色变化。有没有办法将颜色变化设置为自动? - jamen
2你至少可以为演示使用一个柱状图。 - Farzher
它不会工作,因为所有数据点都在一个系列中,而那些颜色是用于染色系列的... - philw
10
您可以在Highchart图表中添加颜色数组来更改图表的颜色。您可以重新排列这些颜色,并且还可以指定自己的颜色。
$('#container').highcharts({
colors: ['#2f7ed8','#910000','#8bbc21','#1aadce'],
chart: {
type: 'column'
},
title: {
text: 'Stacked column chart'
},
- Prem Kumar Maurya
4
如 antonversal 所提到的,通过阅读颜色并在创建图表对象时使用颜色选项即可实现。
var chart3 = new Highcharts.Chart({colors: ['#458006', '#B0D18C']});
- thirumalaa srinivas
2
只需放置图表
$('#container').highcharts({
colors: ['#31BFA2'], // change color here
chart: {
        type: 'column'
}, .... Continue chart
- pradip kor
1
只需添加这个...或者按照您的需求更改颜色。
Highcharts.setOptions({
        colors: ['#811010', '#50B432', '#ED561B', '#DDDF00', '#24CBE5', '#64E572', '#FF9655', '#FFF263', '#6AF9C4'],
        plotOptions: {
            column: {
                colorByPoint: true
            }
        }

    });
- V.Ahlawat
1
添加属性:
colors: ['Red', 'Bule', 'Yellow']
- Tran Anh Hien
0
这对我很有用。为一个系列设置所有颜色选项非常繁琐,特别是如果它是动态的。
plotOptions: {
  column: {
   colorByPoint: true
  }
}
- Leo Rams
网页内容由stack overflow 提供, 点击上面的可以查看英文原文,
原文链接
原文链接