我正在尝试制作一个条形图,我的代码是
data = np.genfromtxt("ca1_data/distance.csv",
               delimiter=',',skip_header=1,
               dtype=[('Year','i4'),('Mode','U50'),('Distance','U10')],
               missing_values=['na','-'],filling_values=[0])
years = np.arange(5)
scores = [(data[(data['Mode']=='MRT') & (data['Year']>=2010)]['Distance']),
          (data[(data['Mode']=='Bus') & (data['Year']>=2010)]['Distance'])]
labels = np.arange(2010,2015)
print(scores)
fig = plt.figure(figsize=(20,10))
ax1 = fig.add_subplot(111)
ax1.set_xticklabels(labels, fontsize=10)
plt.title(title)
plt.xlabel('Years')
plt.ylabel('Distance')
bp_dict = plt.bar(scores,10,labels=labels)
plt.show()
问题是我遇到了错误
bar() missing 1 required positional argument: 'height'
所以我手动添加了它。
bp_dict = plt.bar(scores,10,labels=labels)
然而,我遇到了另一个错误。
TypeError: unhashable type: 'numpy.ndarray'
感谢您的提前帮助!
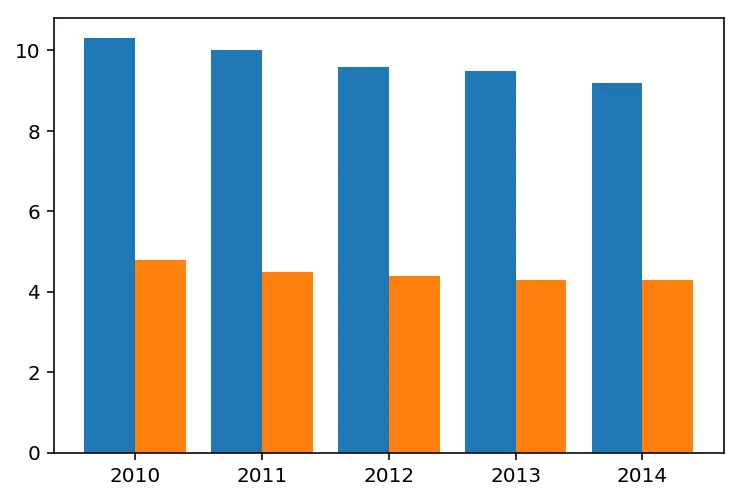
更新: 以下是得分输出结果。
[array(['10.3', '10', '9.6', '9.5', '9.2'], dtype='<U10'), array(['4.8', '4.5', '4.4', '4.3', '4.3'], dtype='<U10')]
更新2: 我已更新代码。
scores = list(map(float, np.array(scores).flatten()))
我把这个放进去后出现了新的错误。
AttributeError: Unknown property labels
print(scores)时会得到什么结果。 - Sheldorescores = list(map(float, np.array(scores).flatten()))。 - Sheldore