使用未排序数据相交的matplotlib图表

15

使用 matplotlib 绘制一些点时,我遇到了一些奇怪的行为,导致无法正常创建图形。以下是产生此图的代码。

import matplotlib.pyplot as plt
desc_x =[4000,3000,2000,2500,2750,2250,2300,2400,2450,2350]
rmse_desc = [.31703 , .31701, .31707, .31700, .31713, .31698, .31697, .31688, .31697, .31699]

fig = plt.figure()
ax = plt.subplot(111)

fig.suptitle('title')
plt.xlabel('x')
plt.ylabel('y')

ax.plot(desc_x, rmse_desc, 'b', label='desc' )
ax.legend()
plt.show()

这是它创建的图表:

交错线的图表

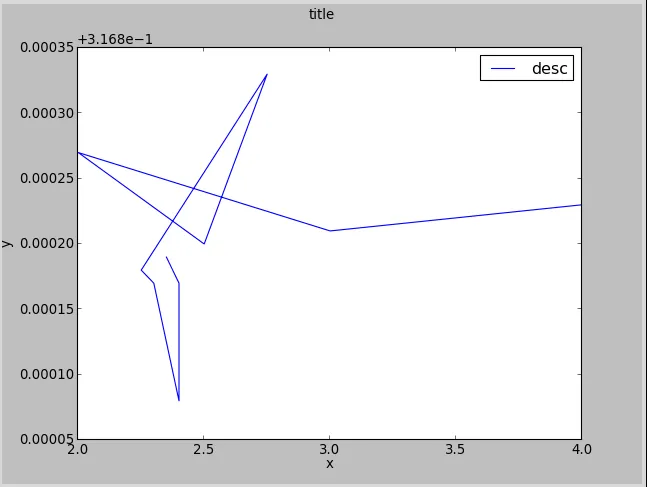
正如你所看到的,这个图表有交错的线条,这在一张折线图中是不常见的。当我只关注点,并不绘制线条时,得到的结果是:

没有交错线的图表

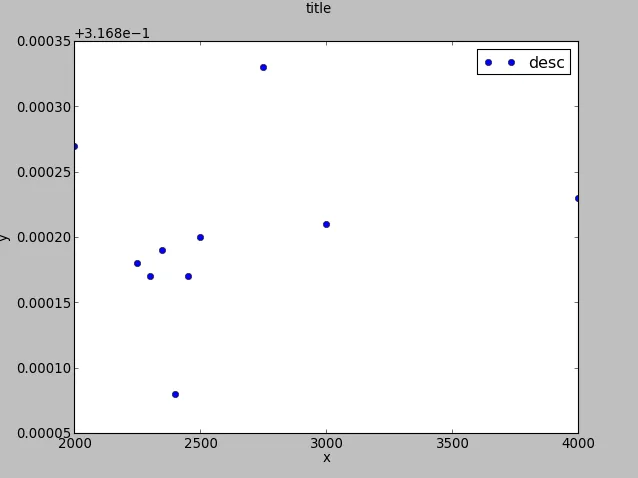
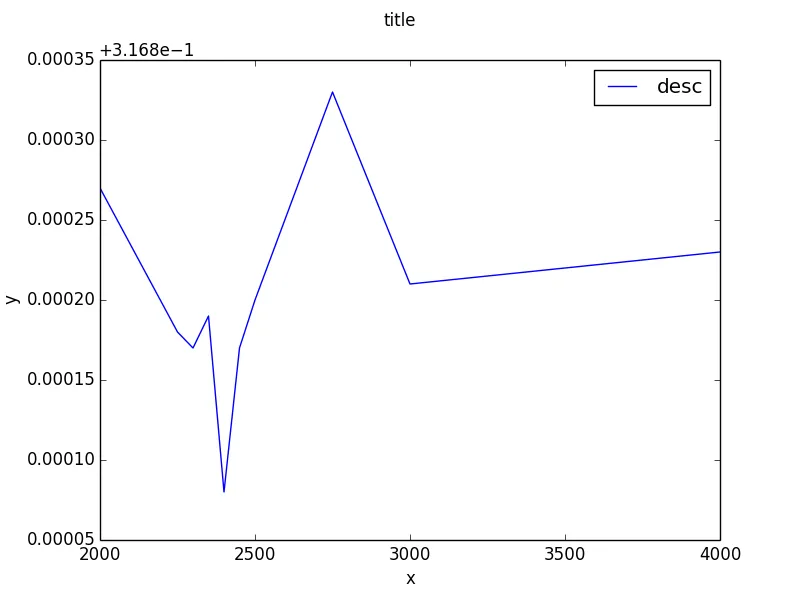
如你所见,有一种方法可以连接这些点而不形成交错线。

为什么Matplotlib会这样做?我认为我可以通过让我的x列不排序来解决它,但如果我排序它,我将失去从x1到y1的映射。


desc_xrmse_desc之间是否存在任何功能关系? - rainman
1个回答

25
你可以使用numpy的argsort函数来维护顺序。
Argsort“...返回一个与a相同形状的索引数组,该数组沿给定轴排序索引数据”,因此我们可以使用它来重新排序x和y坐标。下面是操作方法:
import matplotlib.pyplot as plt
import numpy as np

desc_x =[4000,3000,2000,2500,2750,2250,2300,2400,2450,2350]
rmse_desc = [.31703 , .31701, .31707, .31700, .31713, .31698, .31697, .31688, .31697, .31699]

order = np.argsort(desc_x)
xs = np.array(desc_x)[order]
ys = np.array(rmse_desc)[order]

fig = plt.figure()
ax = plt.subplot(111)

fig.suptitle('title')
plt.xlabel('x')
plt.ylabel('y')

ax.plot(xs, ys, 'b', label='desc' )
ax.legend()
plt.show()

enter image description here


太好了,谢谢。我的猜测是否正确,图形看起来很奇怪是因为x值未排序? - nook
1
啊,是的,那是正确的。Matplotlib会按照您提供的顺序在每对之间绘制线条。 - YXD
你也可以使用 xs, ys = zip(*sorted(zip(desc_x, rmse_desc))) 来实现类似的功能,但我更喜欢使用 numpy 的方式。 - YXD
我无法理解奇怪的图表原因。我有一个分类变量(月份;x)和故障数量(y)。两者都排过序,但仍然得到相同的奇怪图表。 - Arpit Sisodia
https://stackoverflow.com/questions/55140745/matplotlib-pyplot-plot-function-shows-incorrect-sequence-of-points?noredirect=1#comment97021695_55140745 - Arpit Sisodia

网页内容由stack overflow 提供, 点击上面的
可以查看英文原文,
原文链接