var chart = c3.generate({
bindto: "#chart",
data: {
columns: [
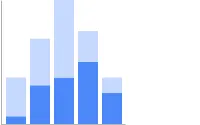
['data1', -30, 200, 200, 400, -150, 250],
['data2', 130, 100, -100, 200, -150, 50],
['data3', -230, 200, 200, -300, 250, 250]
],
type: 'bar',
groups: [
['data1', 'data2']
]
},
grid: {
y: {
lines: [{value:0}]
}
}
});
setTimeout(function () {
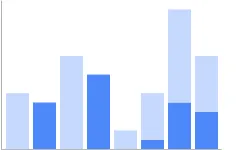
chart.groups([['data1', 'data2', 'data3']])
}, 1000);
setTimeout(function () {
chart.load({
columns: [['data4', 100, -50, 150, 200, -300, -100]]
});
}, 2000);
setTimeout(function () {
chart.groups([['data1', 'data2', 'data3', 'data4']])
}, 3000);
.c3 svg {
font: 10px sans-serif; }
.c3 path, .c3 line {
fill: none;
stroke: #000; }
.c3 text {
-webkit-user-select: none;
-moz-user-select: none;
user-select: none; }
.c3-legend-item-tile, .c3-xgrid-focus, .c3-ygrid, .c3-event-rect, .c3-bars path {
shape-rendering: crispEdges; }
.c3-chart-arc path {
stroke: #fff; }
.c3-chart-arc text {
fill: #fff;
font-size: 13px; }
.c3-grid line {
stroke: #aaa; }
.c3-grid text {
fill: #aaa; }
.c3-xgrid, .c3-ygrid {
stroke-dasharray: 3 3; }
.c3-text.c3-empty {
fill: #808080;
font-size: 2em; }
.c3-line {
stroke-width: 1px; }
.c3-circle._expanded_ {
stroke-width: 1px;
stroke: white; }
.c3-selected-circle {
fill: white;
stroke-width: 2px; }
.c3-bar {
stroke-width: 0; }
.c3-bar._expanded_ {
fill-opacity: 0.75; }
.c3-target.c3-focused {
opacity: 1; }
.c3-target.c3-focused path.c3-line, .c3-target.c3-focused path.c3-step {
stroke-width: 2px; }
.c3-target.c3-defocused {
opacity: 0.3 !important; }
.c3-region {
fill: steelblue;
fill-opacity: 0.1; }
.c3-brush .extent {
fill-opacity: 0.1; }
.c3-legend-item {
font-size: 12px; }
.c3-legend-item-hidden {
opacity: 0.15; }
.c3-legend-background {
opacity: 0.75;
fill: white;
stroke: lightgray;
stroke-width: 1; }
.c3-tooltip-container {
z-index: 10; }
.c3-tooltip {
border-collapse: collapse;
border-spacing: 0;
background-color: #fff;
empty-cells: show;
-webkit-box-shadow: 7px 7px 12px -9px #777777;
-moz-box-shadow: 7px 7px 12px -9px #777777;
box-shadow: 7px 7px 12px -9px #777777;
opacity: 0.9; }
.c3-tooltip tr {
border: 1px solid #CCC; }
.c3-tooltip th {
background-color: #aaa;
font-size: 14px;
padding: 2px 5px;
text-align: left;
color: #FFF; }
.c3-tooltip td {
font-size: 13px;
padding: 3px 6px;
background-color: #fff;
border-left: 1px dotted #999; }
.c3-tooltip td > span {
display: inline-block;
width: 10px;
height: 10px;
margin-right: 6px; }
.c3-tooltip td.value {
text-align: right; }
.c3-area {
stroke-width: 0;
opacity: 0.2; }
.c3-chart-arcs-title {
dominant-baseline: middle;
font-size: 1.3em; }
.c3-chart-arcs .c3-chart-arcs-background {
fill: #e0e0e0;
stroke: none; }
.c3-chart-arcs .c3-chart-arcs-gauge-unit {
fill: #000;
font-size: 16px; }
.c3-chart-arcs .c3-chart-arcs-gauge-max {
fill: #777; }
.c3-chart-arcs .c3-chart-arcs-gauge-min {
fill: #777; }
.c3-chart-arc .c3-gauge-value {
fill: #000;
}
<script src="https://cdnjs.cloudflare.com/ajax/libs/d3/3.4.11/d3.min.js"></script>
<script src="https://raw.githubusercontent.com/masayuki0812/c3/0.4.10/c3.min.js"></script>
<div id="chart"></div>