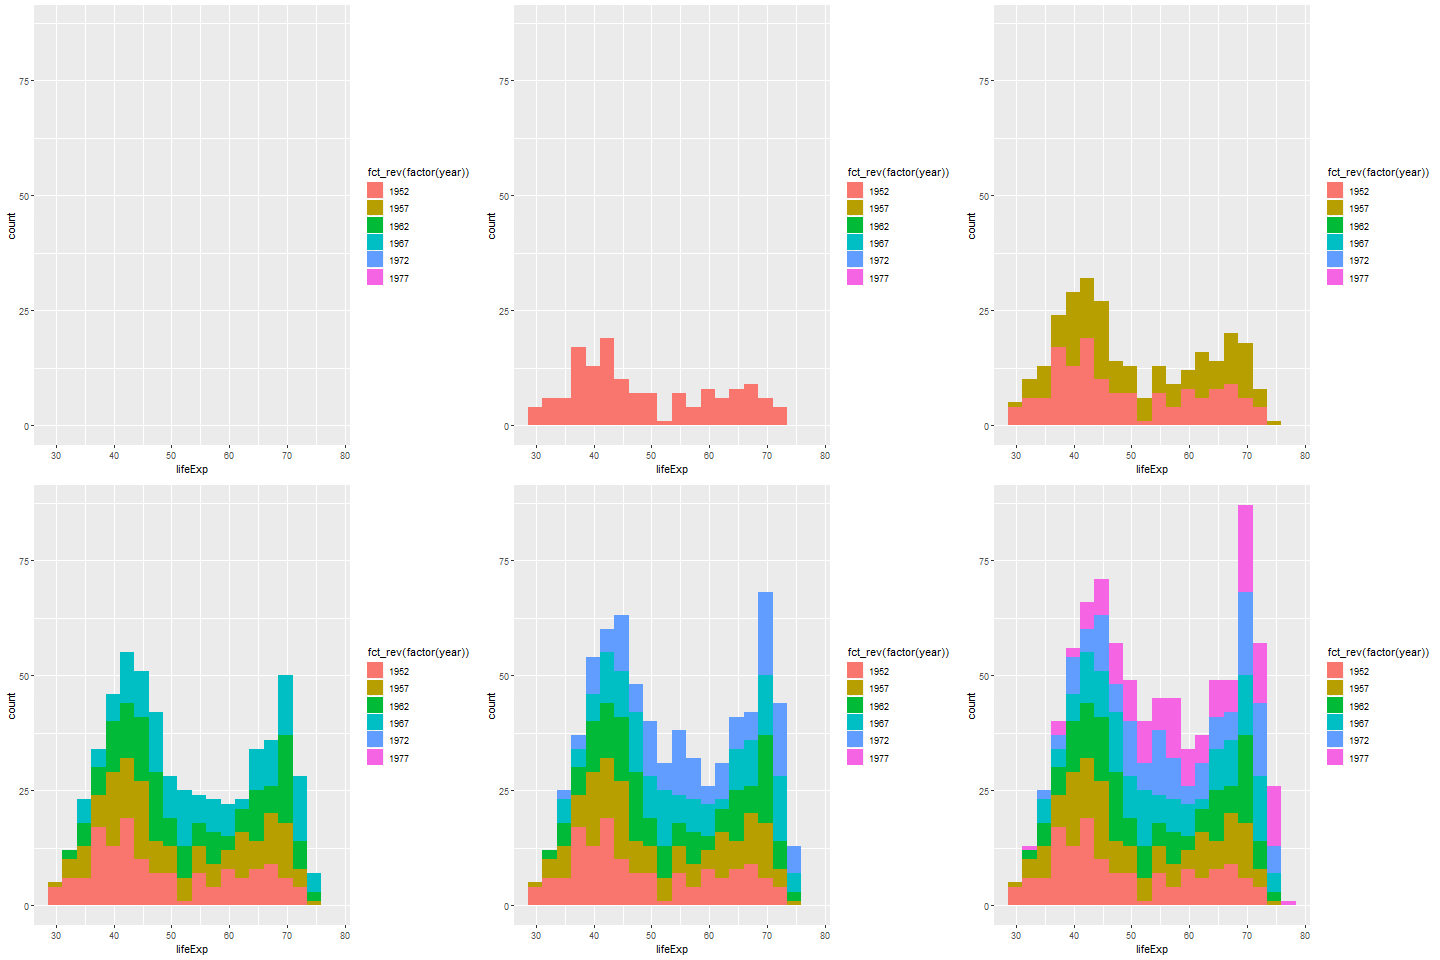
我试图展示一个随着时间累积的柱状图。它会从1952年的数据开始,然后每年更新直到增长完成。
似乎使用gganimate路径,并且我认为可以使用transition_reveal慢慢透露更多随时间而来的数据。但这似乎不起作用。
假设我从这个开始:
library(gapminder)
library(tidyverse)
library(gganimate)

ggplot(gapminder,
       aes(lifeExp, fill = fct_rev(factor(year)), group = fct_rev(factor(year)))) +
  geom_histogram(position = "stack", bins = 20) +
  transition_reveal(year)
这段代码极不稳定。
我可以使用transition_layer将一些东西临时结合在一起,示例如下:
ggplot(gapminder, aes(lifeExp, fill = fct_rev(factor(year)))) +
  geom_histogram(position = "stack", bins = 20,
                 data = filter(gapminder, year<= 1952)) +
  geom_histogram(position = "stack", bins = 20,
                 data = filter(gapminder, year<= 1957)) +
  geom_histogram(position = "stack", bins = 20,
                 data = filter(gapminder, year<= 1962)) +
  geom_histogram(position = "stack", bins = 20,
                 data = filter(gapminder, year<= 1967)) +
  geom_histogram(position = "stack", bins = 20,
                 data = filter(gapminder, year<= 1972)) +
  geom_histogram(position = "stack", bins = 20,
                 data = filter(gapminder, year<= 1977)) +
  transition_layers()
这里有一种能够达到所需结果的方法,但不太方便。有更加便携的方法吗?
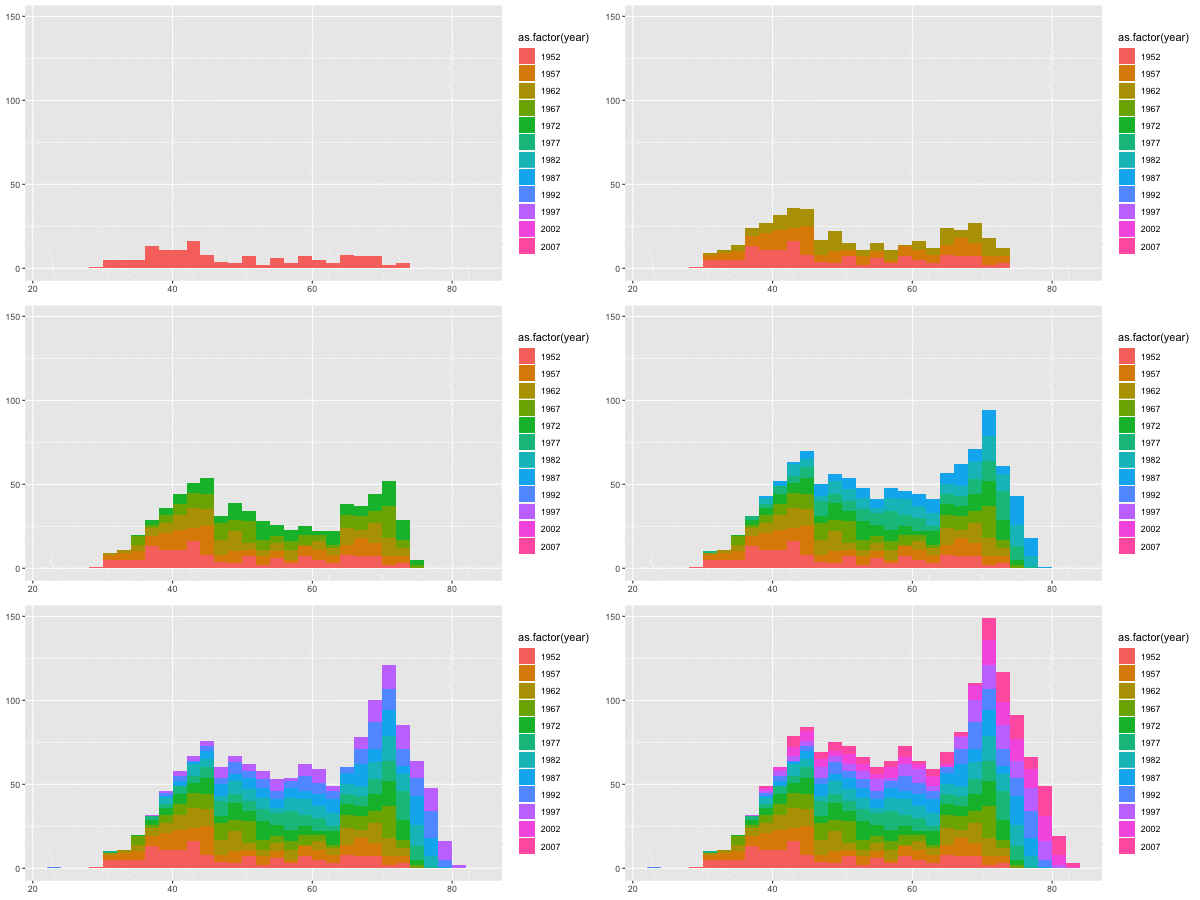
这是我要寻找的效果的一个gif演示:

