我对这个问题已经感到困惑很长时间了。一个简单的数据框架构建如下:
data <- data.frame(
  x = 1:5,
  y = 5:1,
  fill = c(rep("pink", 3), rep("blue", 2)),
  shape = c(rep(21, 3), rep(22, 2))
)
假设我想显示填充的图例
uniFill <- unique(data$fill)
p <- ggplot(data,
mapping = aes(x = x,
y = y,
fill = fill)) +
geom_point(shape = data$shape) +
# show legend so that I do not call `scale_fill_identity()`
scale_fill_manual(values = uniFill,
labels = uniFill,
breaks = uniFill)
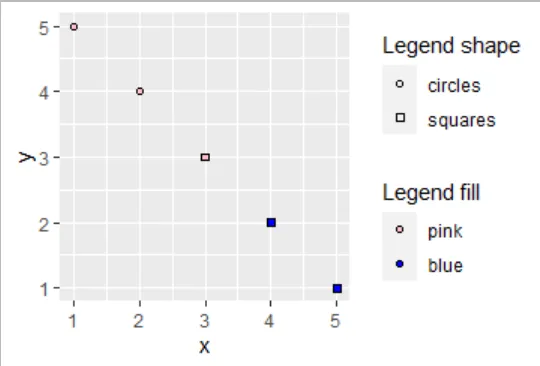
p
这个图形还可以,但是图例不正确。
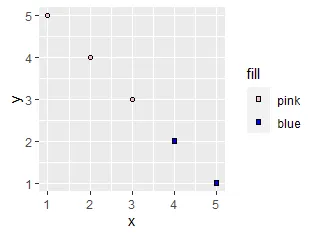
data1 <- data[1:3, ]
data2 <- data[4:5, ]
# > data1$shape
# [1] 21 21 21
# > data2$shape
# [1] 22 22
ggplot(mapping = aes(x = x,
                     y = y,
                     fill = fill)) +
  geom_point(data = data1, shape = data1$shape) +
  geom_point(data = data2, shape = data2$shape) +
  scale_fill_manual(values = uniFill,
                    labels = uniFill,
                    breaks = uniFill)
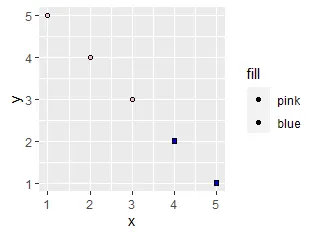
不幸的是,传说没有改变。然后,我将形状从向量更改为标量,如下:
ggplot(mapping = aes(x = x,
                     y = y,
                     fill = fill)) +
  geom_point(data = data1, shape = 21) +
  geom_point(data = data2, shape = 22) +
  scale_fill_manual(values = uniFill,
                    labels = uniFill,
                    breaks = uniFill)
“填充颜色的传说最终是正确的...”
一种可能的解决方案是可以添加组件
guides(),如下所示:p +
guides(fill = guide_legend(override.aes = list(fill = uniFill,
shape = 21)))
但是我更感兴趣的是为什么
p 不起作用(图例)。