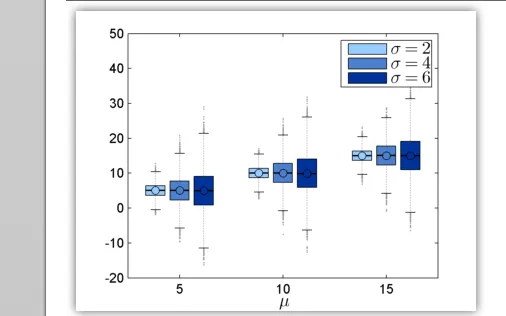
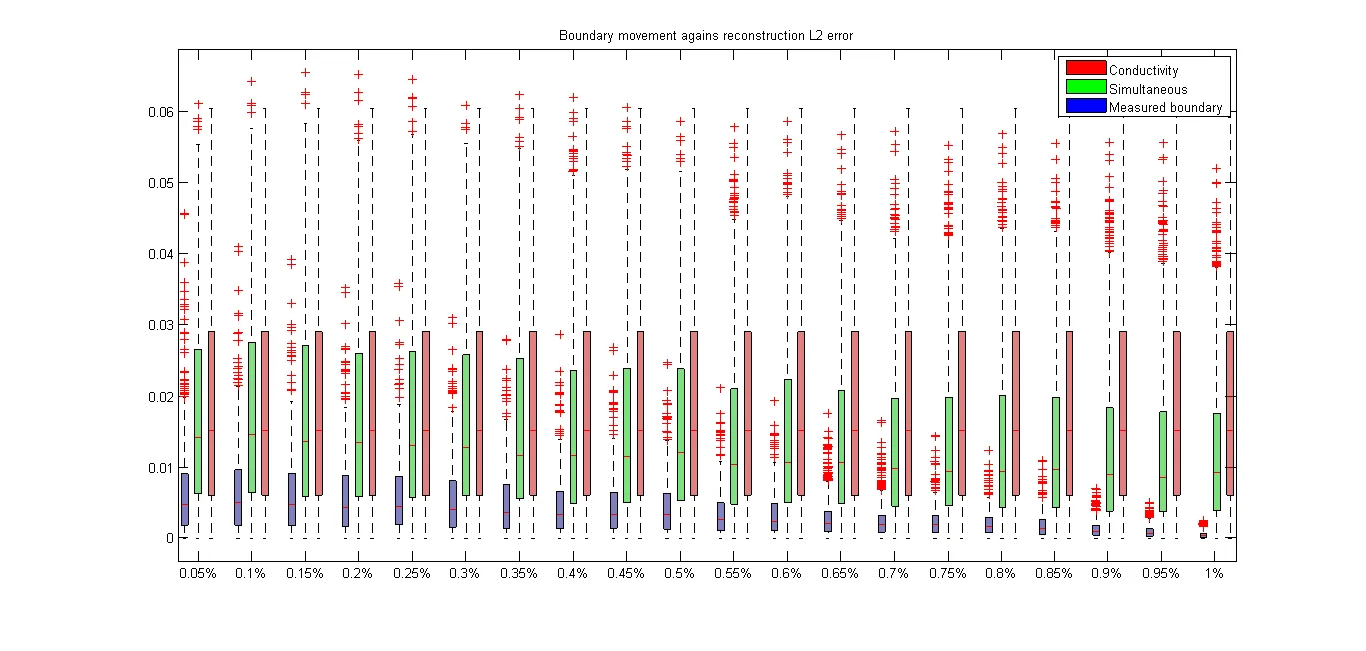
看到这篇SO上的好文章后:
我想知道是否有可能创建一个更通用的函数,因为在我的应用程序中,我需要对不同算法在不同情况下进行多个分析,调整每种情况的绘图代码将非常繁琐。
我希望有一些通用于此类绘图的东西:
看到这篇SO上的好文章后:
我想知道是否有可能创建一个更通用的函数,因为在我的应用程序中,我需要对不同算法在不同情况下进行多个分析,调整每种情况的绘图代码将非常繁琐。
我希望有一些通用于此类绘图的东西:
function multiple_boxplot(data,xlab,Mlab,colors)

% data is a cell matrix of MxL where in each element there is a array of N
% length. M is how many data for the same group, L, how many groups.
%
% Optional:
% xlab is a cell array of strings of length L with the names of each
% group
%
% Mlab is a cell array of strings of length M
%
% colors is a Mx4 matrix with normalized RGBA colors for each M.

% check that data is ok.
if ~iscell(data)
    error('Input data is not even a cell array!');
end

% Get sizes
M=size(data,2);
L=size(data,1);
if nargin>=4
    if size(colors,2)~=M
        error('Wrong amount of colors!');
    end
end
if nargin>=2
    if length(xlab)~=L
        error('Wrong amount of X labels given');
    end
end

% Calculate the positions of the boxes
positions=1:0.25:M*L*0.25+1+0.25*L;
positions(1:M+1:end)=[];

% Extract data and label it in the group correctly
x=[];
group=[];
for ii=1:L
    for jj=1:M
        aux=data{ii,jj};
        x=vertcat(x,aux(:));
        group=vertcat(group,ones(size(aux(:)))*jj+(ii-1)*M);
    end
end
% Plot it
boxplot(x,group, 'positions', positions);

% Set the Xlabels
aux=reshape(positions,M,[]);
labelpos = sum(aux,1)./M;

set(gca,'xtick',labelpos)
if nargin>=2
    set(gca,'xticklabel',xlab);
else
    idx=1:L;
    set(gca,'xticklabel',strsplit(num2str(idx),' '));
end


% Get some colors
if nargin>=4
    cmap=colors;
else
    cmap = hsv(M);
    cmap=vertcat(cmap,ones(1,M)*0.5);
end
color=repmat(cmap, 1, L);

% Apply colors
h = findobj(gca,'Tag','Box');
for jj=1:length(h)
   patch(get(h(jj),'XData'),get(h(jj),'YData'),color(1:3,jj)','FaceAlpha',color(4,jj));
end

if nargin>=3
    legend(fliplr(Mlab));
end
end
clear;clc;
% Create example data
A=rand(100,10);
B=rand(200,10);
C=rand(150,10);
% prepare data
data=cell(10,3);
for ii=1:size(data,1)
Ac{ii}=A(:,ii);
Bc{ii}=B(:,ii);
Cc{ii}=C(:,ii);
end
data=vertcat(Ac,Bc,Cc);
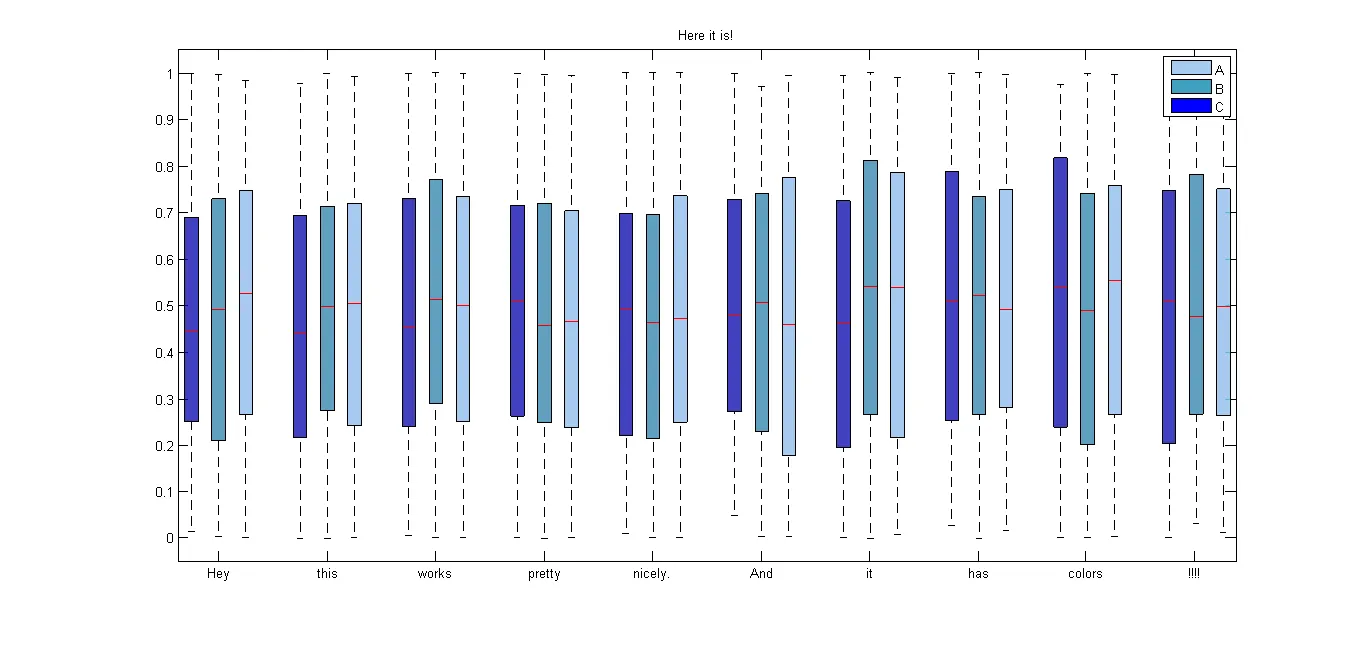
xlab={'Hey','this','works','pretty','nicely.','And','it','has','colors','!!!!'};
col=[102,255,255, 200;
51,153,255, 200;
0, 0, 255, 200];
col=col/255;
multiple_boxplot(data',xlab,{'A', 'B', 'C'},col')
title('Here it is!')
可以在这里找到Mathworks文件交换文件: http://www.mathworks.com/matlabcentral/fileexchange/47233-m