如何在ggplot2中更改坐标轴标签上的小数位数?

83

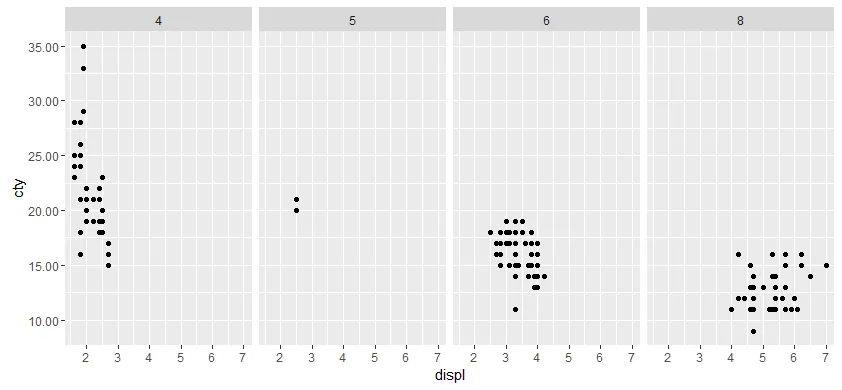
具体来说,这是在一个facet_grid中。我已经广泛地搜索了类似的问题,但对语法或其位置不清楚。我的目标是使y轴上的每个数字都保留两位小数,即使最后一位是0。这是scale_y_continuous或element_text中的参数吗?

row1 <- ggplot(sector_data[sector_data$sector %in% pages[[x]],], aes(date,price)) + geom_line() +
  geom_hline(yintercept=0,size=0.3,color="gray50") +
  facet_grid( ~ sector) +
  scale_x_date( breaks='1 year', minor_breaks = '1 month') +
  scale_y_continuous( labels = ???) +
  theme(panel.grid.major.x = element_line(size=1.5),
        axis.title.x=element_blank(),
        axis.text.x=element_blank(),
        axis.title.y=element_blank(),
        axis.text.y=element_text(size=8),
        axis.ticks=element_blank()
  )
4个回答

92

根据?scale_y_continuous的帮助文档,参数'labels'可以是一个函数:

labels参数可选值包括:

  • NULL表示无标签

  • waiver()表示使用转换对象计算的默认标签

  • 一个字符向量,给出与breaks相同长度的标签

  • 一个以breaks为输入、返回带有2位小数的标签的函数

我们将使用最后一种选项,即一个以breaks为参数并返回带有2位小数的数字标签的函数。

#Our transformation function
scaleFUN <- function(x) sprintf("%.2f", x)

#Plot
library(ggplot2)
p <- ggplot(mpg, aes(displ, cty)) + geom_point()
p <- p + facet_grid(. ~ cyl)
p + scale_y_continuous(labels=scaleFUN)

输入图像描述


85

"scales"包中有一些很好的功能可以格式化坐标轴。其中之一是number_format()函数。因此,您不必先定义自己的函数。

library(ggplot2)
# building on Pierre's answer
p <- ggplot(mpg, aes(displ, cty)) + geom_point()
p <- p + facet_grid(. ~ cyl)

# here comes the difference
p + scale_y_continuous(
  labels = scales::number_format(accuracy = 0.01))

# the function offers some other nice possibilities, such as controlling your decimal 
# mark, here ',' instead of '.'
p + scale_y_continuous(
  labels = scales::number_format(accuracy = 0.01,
                                 decimal.mark = ','))

18

更新了scales包,并停用了number_format()函数。请使用label_number()替代。此函数同样适用于百分比和其他连续型刻度(例如:label_percent()https://scales.r-lib.org/reference/label_percent.html)。

#updating Rtists answer with latest syntax from scales
library(ggplot2); library(scales)

p <- ggplot(mpg, aes(displ, cty)) + geom_point()
p <- p + facet_grid(. ~ cyl)

# number_format() is retired; use label_number() instead
p + scale_y_continuous(
  labels = label_number(accuracy = 0.01)
)

# for whole numbers use accuracy = 1
p + scale_y_continuous(
  labels = label_number(accuracy = 1)
)

1
有几个人建议使用"scales"包,但是你也可以在这里使用基本的R语言通过使用"format()"函数来实现几乎相同的效果。
require(ggplot2)

ggplot(iris, aes(y = Sepal.Length, x = Sepal.Width)) +
  geom_point() +
  scale_y_continuous(labels = function(x) format(x, nsmall = 2)) +
  facet_wrap(~Species)

网页内容由stack overflow 提供, 点击上面的
可以查看英文原文,
原文链接