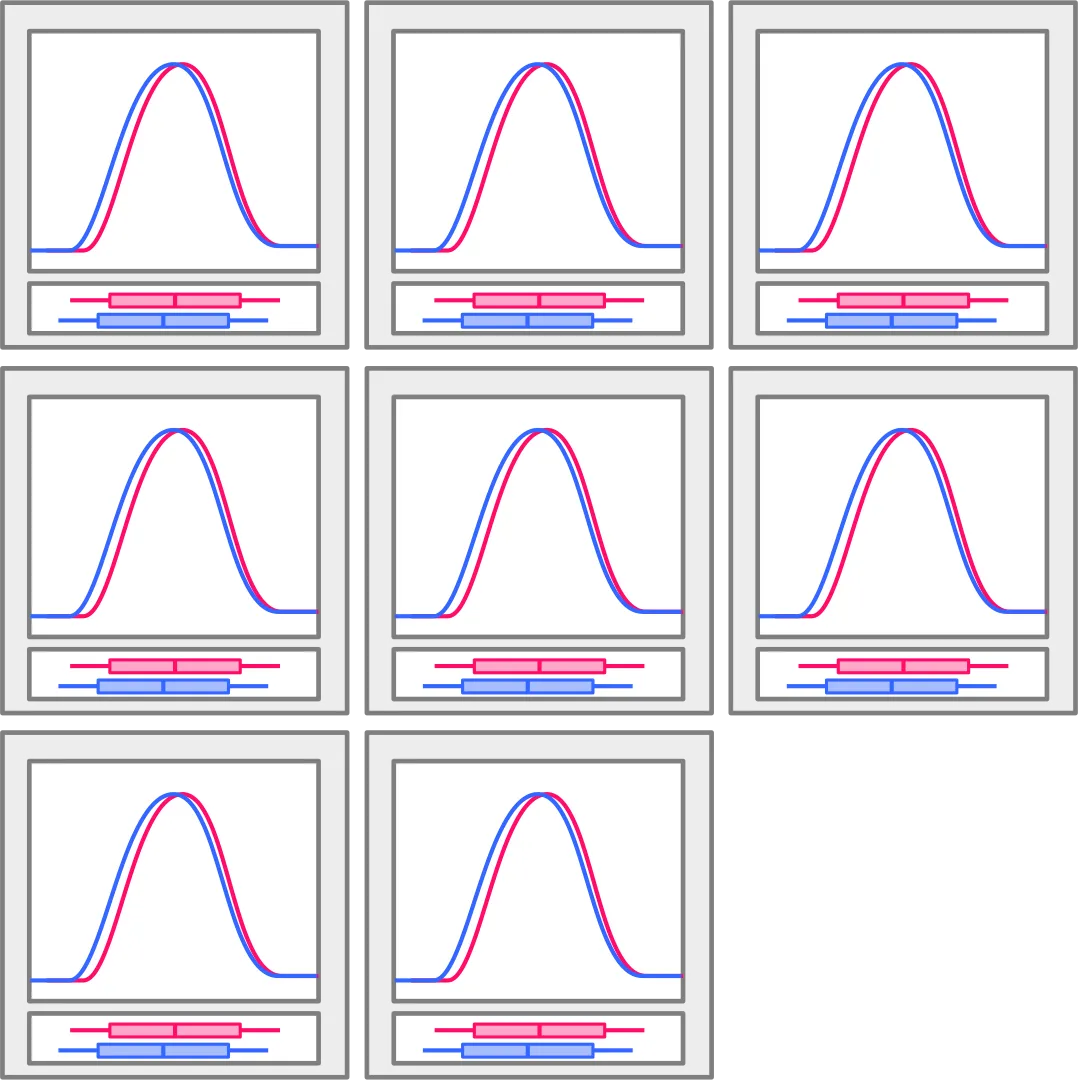
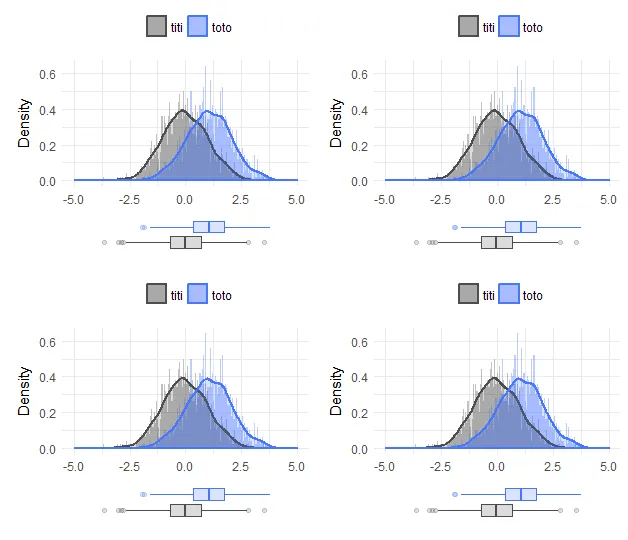
我尝试使用ggplot2生成多个网格图。因此,我想要生成附加的箱线图分布图,在x轴下方,并针对不同的组和变量,像这样:
代码: 我尝试使用以下代码进行操作 :
library(ggplot2)
require(grid)

x=rbind(data.frame(D1=rnorm(1000),Name="titi",ID=c(1:1000)),
    data.frame(D1=rnorm(1000)+1,Name="toto",ID=c(1:1000)))

space=1
suite=1
p1=ggplot(x, aes(x=D1, color=Name, fill=Name)) +
geom_histogram(aes(y=..density..),alpha=0.35,color=adjustcolor("white",0),position="identity",binwidth = 0.05)+
  geom_density(alpha=.2,size=1)+
  theme_minimal()+
  labs(x=NULL,y="Density")+
  theme(legend.position = "top",
        legend.title = element_blank())+
  scale_fill_manual(values=c("gray30","royalblue1"))+
  scale_color_manual(values=c("gray30","royalblue1"))

p2=ggplot(x, aes(x=factor(Name), y=D1,fill=factor(Name),color=factor(Name)))+
  geom_boxplot(alpha=0.2)+
  theme_minimal()+
  coord_flip()+
  labs(x=NULL,y=NULL)+
  theme(legend.position = "none",
        axis.text.y = element_blank(),
        axis.text.x = element_blank(),
        panel.grid.minor.x = element_blank(),
        panel.grid.major.x = element_blank(),
        panel.grid.minor.y = element_blank(),
        panel.grid.major.y = element_blank())+
  scale_fill_manual(values=c("gray30","royalblue1"))+
  scale_color_manual(values=c("gray30","royalblue1"))

grid.newpage()
pushViewport(viewport(layout=grid.layout(5,1)))
define_region <- function(row, col){
  viewport(layout.pos.row = row, layout.pos.col = col)
}
print(p1, vp=define_region(1:4,1))
print(p2, vp=define_region(5,1))
结果:
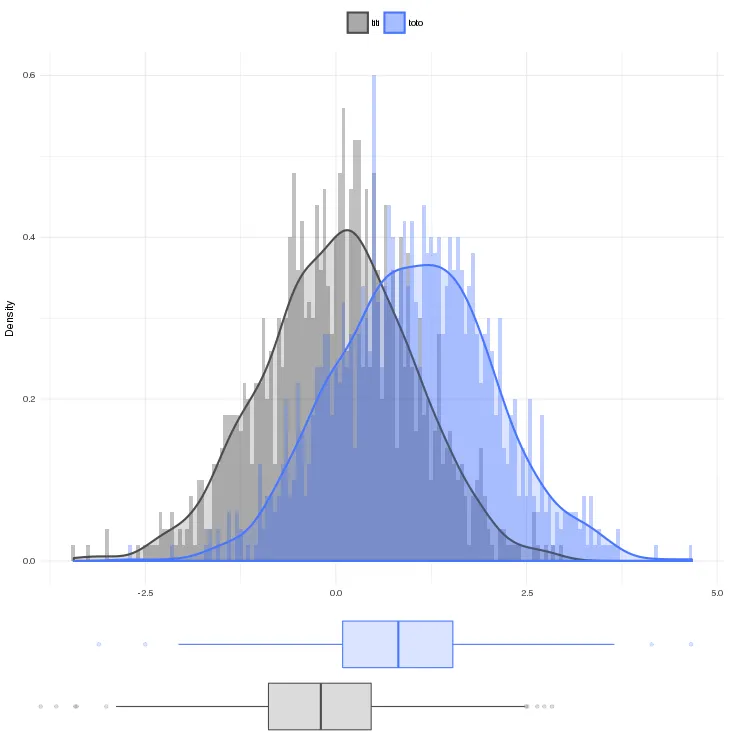
问题:我在搜索过程中发现密度分布图和箱线图的比例不同(问题1)。我没有找到在网格中绘制这两个图形的解决方案(我迷失了方向)。
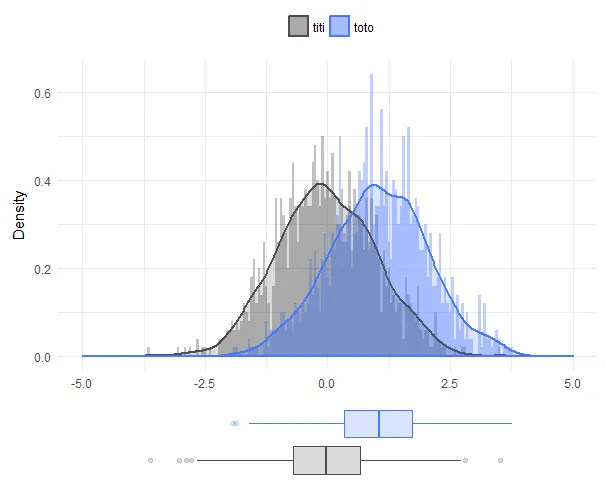
p2<-p2+theme(plot.margin = unit(c(0,0.3,0,1.5), "cm"))这一行代码是一个折中的解决方法。使用这种解决方法可能需要对箱线图边距进行微调。如果有人能想出一种同时设置p1的边距并将其应用于p2的方法,那就更好了。 - N8TRO