from matplotlib import markers
import numpy as np
import matplotlib.pyplot as plt
from matplotlib.cm import get_cmap
plt.rcParams['figure.figsize'] = [9,9]
plt.rcParams.update({'font.size' : 16})
#domain definition
dx = 0.01 #input("input the step size: ")
x = np.pi*np.arange(-1+ float(dx),1+float(dx),float(dx))
n = len(x)
nquart = int(np.floor(n/4))
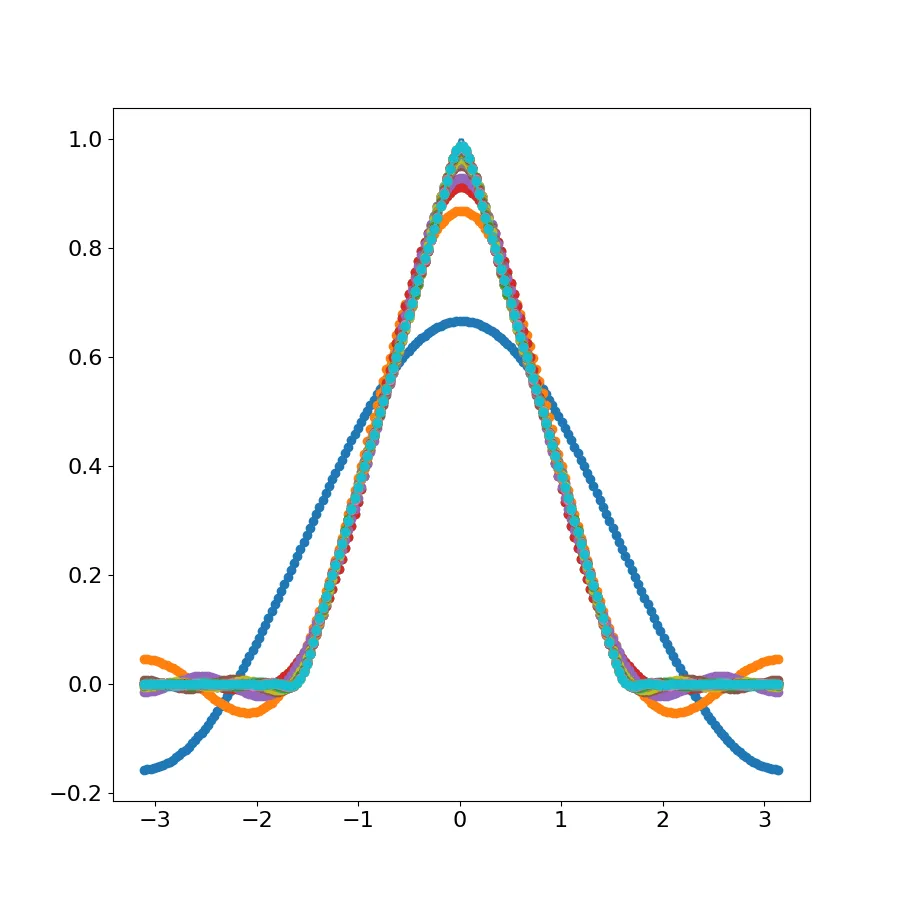
#hat funtion
f = np.zeros_like(x)
f[nquart : 2*nquart] = (4/n)*np.arange(1,nquart+1)
f[2*nquart:3*nquart] = np.ones(nquart) - (4/n)*np.arange(0,nquart)
#subplot creation
fig,ax = plt.subplots(1)
ax.plot(x,f)
#core fourier series
name = 'accent'
cmap = get_cmap('tab10')
colors = cmap.colors
ax.set_prop_cycle(color = colors)
# sum of values with an array of ones with the same shape and type as a given array.
Ao = np.sum(f*np.ones_like(x))*dx
ffs = Ao/2
A = np.zeros(20)
B = np.zeros(20)
for k in range(20):
#the inner products
A[k] = np.sum(f*np.cos(np.pi*(k+1)*(x/np.pi)))*dx
B[k] = np.sum(f*np.sin(np.pi*(k+1)*(x/np.pi)))*dx
ffs = ffs + A[k]*np.cos((k+1)*np.pi*(x/np.pi)) + B[k]*np.sin((k+1)*np.pi*(x/np.pi))
ax.plot(x,ffs,markers = 'o',LineWidth = 1.5)
plt.show()
运行代码时出现错误属性错误:'Line2D'对象没有属性'markers','LineWidth' 如果不使用markers和LineWidth,则代码可以运行,但是预期的结果不是我想要的 我得到了大约15个图形,但这不是我想要的颜色样式也没有应用
marker=后面加上一个s,并且用两个大写字母写linewidth=?请参考ax.plot()文档。此外,你可能想要在for循环结束后只调用一次plt.show(),而不是连续多次调用。 - JohanC