R - 用不同颜色的交叉线填充两条线之间的区域

3
我有一个矩阵(名为ichimoku),其中包含516行和2列,每一列都包含要绘制的值,目标是重新创建Ichimoku 策略的云。使用matpot,我能够绘制这两条曲线,但我想要的是在这两条曲线之间填充颜色。我有两个问题:
  • 我尝试使用多边形来填充颜色,但它不起作用。我怀疑这是因为两个系列(senkouA 和 senkouB)在图上交叉多次,而不是一个始终大于另一个。
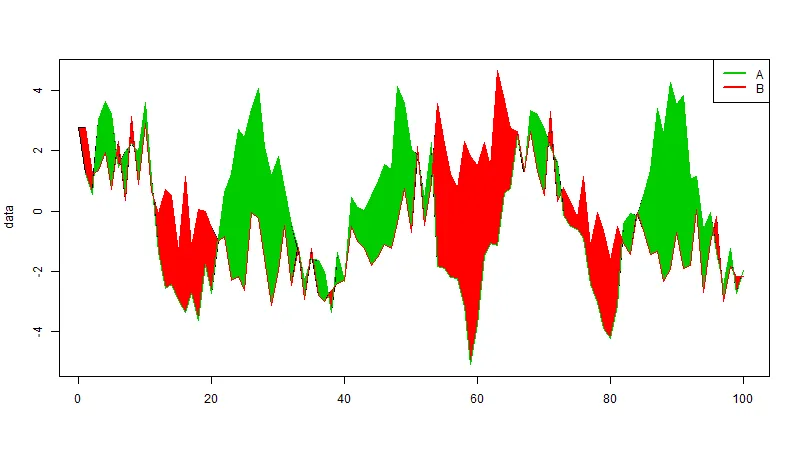
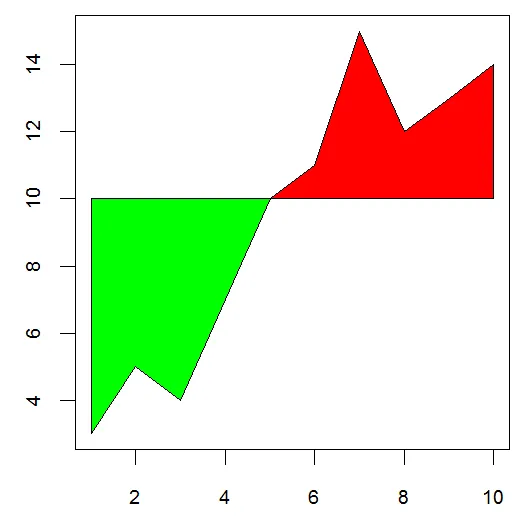
  • 如果senkouA>senkouB,则希望该区域填充绿色;如果senkouB>senkouA,则希望该区域填充红色,但据我所读,多边形只能是一种颜色。

是否有其他函数可以帮助我实现所需的效果,即当senkouA>senkouB时,在senkouA和senkouB之间填充绿色区域,当senkouB>senkouA时,在senkouA和senkouB之间填充红色区域?

一目均衡表看起来像这样(第一列是先行A线,其他是先行B线)
        [,1]      [,2]
[1,] 23323.62   23320.53
[2,] 23334.67   23328.71
[3,] 23334.11   23323.06
[4,] 23332.94   23323.06
...

这是我的 Matplotlib 函数(可以正常工作):

matplot(ichimoku,lty=1,lwd=1,pch=20,type="l",col=c("red","blue"))

和我的多边形函数(它不起作用):

polygon(c(1:516,516:1),c(senkouA,senkouB),col='green')

你有看过 quantmod 包吗? - user3710546
很遗憾,我认为 quantmod 不包含Ichimoku图表。但是这篇博客可能会很有趣。 - RHertel
还有一个关于Ichimoku指标的GitHub帖子 - RHertel
@RHertel 对,我把它和似乎是 Bollinger 带混淆了。对于造成的困惑,我很抱歉。 - user3710546
我必须重新编程一下Ichimoku策略,因此无法使用已经存在的接口。不过,感谢提供的github链接,这会有所帮助。 - etienne
我最近在使用“ggplot2”包和“geom_ribbon()”函数时提出了类似的问题。当时我还没有看到Etienne的问题,所以我想在这里链接一下,以便下一个人更容易地在我们的问题之间导航(虽然这些问题部分重复,但答案并不相同)。 - PatrickT
2个回答

4
如果你找到曲线之间的交点,那么你可以在交点之间绘制多边形。这是对之前一个帖子的修改,其中他们找到了曲线之间的交点,并编写了一个函数来绘制多边形。请参考此链接
## Some sample data
set.seed(0)
dat <- data.frame(x1=3*sin(3*(x=seq(0,10,len=100)))+rnorm(100),
                  x2=2*cos(x)+rnorm(100))

## https://dev59.com/i2Ij5IYBdhLWcg3wMijW
intersects <- function(x1, x2) {
    seg1 <- which(!!diff(x1 > x2))                            # location of first point in crossing segments
    above <- x2[seg1] > x1[seg1]                              # which curve is above prior to crossing
    slope1 <- x1[seg1+1] - x1[seg1]
    slope2 <- x2[seg1+1] - x2[seg1]
    x <- seg1 + ((x2[seg1] - x1[seg1]) / (slope1 - slope2))
    y <- x1[seg1] + slope1*(x - seg1)
    data.frame(x=x, y=y, pindex=seg1, pabove=(1:2)[above+1L])  # pabove is greater curve prior to crossing
}

ichimoku <- function(data, addLines=TRUE) {
    ## Find points of intersections
    ints <- intersects(data[,1], data[,2])
    intervals <- findInterval(1:nrow(data), c(0, ints$x))

    ## Make plot
    matplot(data, type="n", col=2:3, lty=1, lwd=4)
    legend("topright", c("A", "B"), col=3:2, lty=1, lwd=2)

    ## Draw the polygons
    for (i in seq_along(table(intervals))) {
        xstart <- ifelse(i == 1, 0, ints$x[i-1])
        ystart <- ifelse(i == 1, dat[1,ints$pindex[1]], ints$y[i-1])
        xend <- ints$x[i]
        yend <- ints$y[i]
        x <- seq(nrow(data))[intervals == i]
        polygon(c(xstart, x, xend, rev(x)), c(ystart, data[x,1], yend, rev(data[x,2])),
                col=ints$pabove[i]%%2+2)
    }

    ## Add lines for curves
    if (addLines)
        invisible(lapply(1:2, function(x) lines(seq(nrow(data)), data[,x], col=x%%2+2, lwd=2)))
}

## Plot the data
ichimoku(dat)

enter image description here


它的工作效果很好,除了一些问题:我的ints df中第一个pindex等于63(然后是98和105),因此第一个ystart无法工作,因为dat中只有两列而不是63列。我用2替换了ints $ pindex [1],它绘制了多边形,但最后一个没有。感谢您的帖子! - etienne

1

这里有一些代码可以解决你的问题,针对简单版本,其中每条线只交叉一次。然而,我还没有测试过重复交叉的情况。

# Make toy data
ichimoku <- data.frame(senkouA = rep(10, 10), senkouB = c(3, 5, 4, 7, 10, 11, 15, 12, 13, 14))

# Make indices for the conditions that define the fill colors. They need to intersect for the polygons to connect.
index.green = with(ichimoku, as.logical(senkouA >= senkouB))
index.red = with(ichimoku, as.logical(senkouA <= senkouB))

# Make the line plot
matplot(ichimoku, lty=1, lwd=1, pch=20, type="l", col=c("red","blue"))

# Now add polygons with fill color based on those conditions by subsetting the task using the indices.
with(ichimoku, polygon(x = c(seq(length(senkouA))[index.green], rev(seq(length(senkouA))[index.green])),
    y = c(senkouB[index.green], senkouA[index.green]), col = "green"))
with(ichimoku, polygon(x = c(seq(length(senkouA))[index.red], rev(seq(length(senkouA))[index.red])),
    y = c(senkouB[index.red], senkouA[index.red]), col = "red"))

这是我的结果:

enter image description here


谢谢您展示如何做到这一点,我会继续寻找重复交叉点。 - etienne

网页内容由stack overflow 提供, 点击上面的
可以查看英文原文,
原文链接