我有两个向量:
set.seed(1)
x1 = rnorm(100,0,1)
x2 = rnorm(100,1,1)
我想将它们绘制成线,并找到这些线的交点,如果有多个交点,则我想找出每个交点的位置。
我遇到了一个类似的问题,并尝试使用spatstat解决此问题,但我无法将包含向量值的组合数据帧转换为psp对象。
我有两个向量:
set.seed(1)
x1 = rnorm(100,0,1)
x2 = rnorm(100,1,1)
我想将它们绘制成线,并找到这些线的交点,如果有多个交点,则我想找出每个交点的位置。
我遇到了一个类似的问题,并尝试使用spatstat解决此问题,但我无法将包含向量值的组合数据帧转换为psp对象。
如果你只是有两个随机的数字向量,你可以使用一种非常简单的技巧来获取两者交集。只需找到所有满足x1在某点上方,而在下一个点则在其下方(或反之亦然)的点,这些就是交点。然后只需使用相应的斜率来找到该线段的截距。
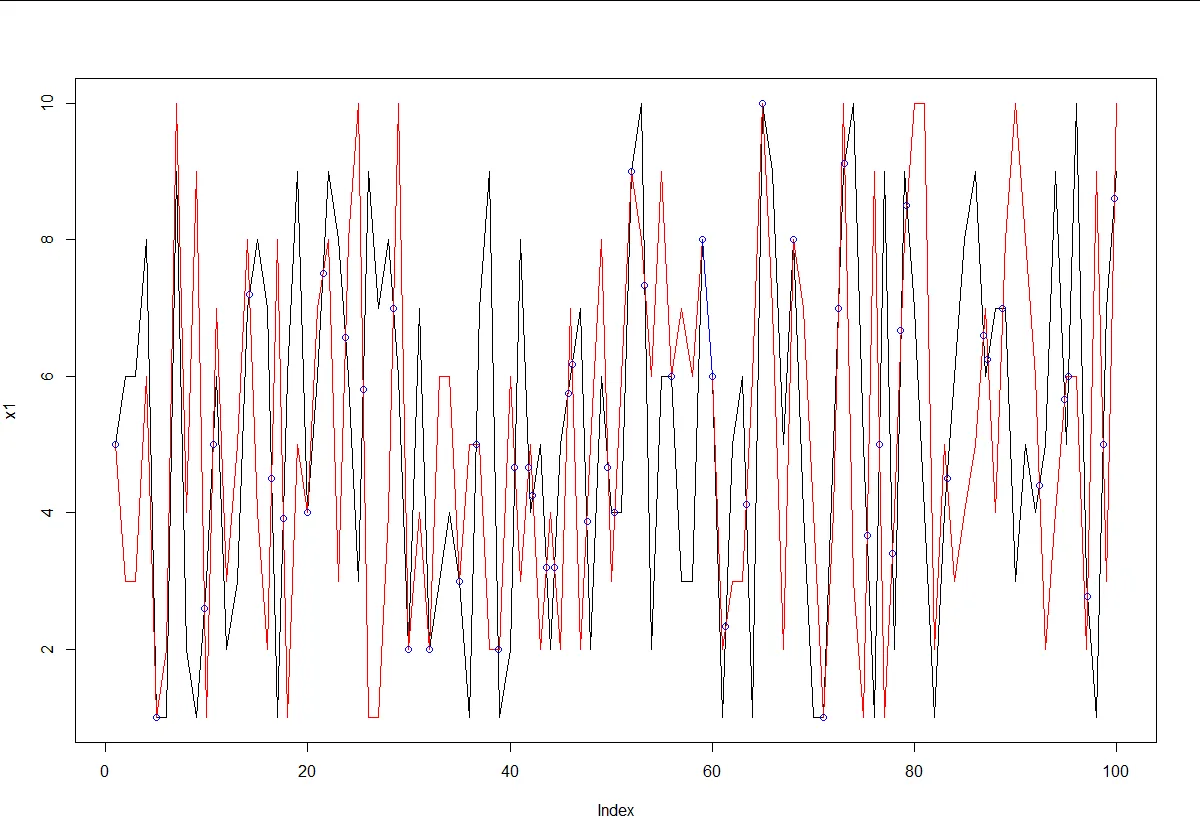
set.seed(2)
x1 <- sample(1:10, 100, replace = TRUE)
x2 <- sample(1:10, 100, replace = TRUE)
# Find points where x1 is above x2.
above <- x1 > x2
# Points always intersect when above=TRUE, then FALSE or reverse
intersect.points <- which(diff(above) != 0)
# Find the slopes for each line segment.
x1.slopes <- x1[intersect.points+1] - x1[intersect.points]
x2.slopes <- x2[intersect.points+1] - x2[intersect.points]
# Find the intersection for each segment.
x.points <- intersect.points + ((x2[intersect.points] - x1[intersect.points]) / (x1.slopes-x2.slopes))
y.points <- x1[intersect.points] + (x1.slopes*(x.points-intersect.points))
# Joint points
joint.points <- which(x1 == x2)
x.points <- c(x.points, joint.points)
y.points <- c(y.points, x1[joint.points])
# Plot points
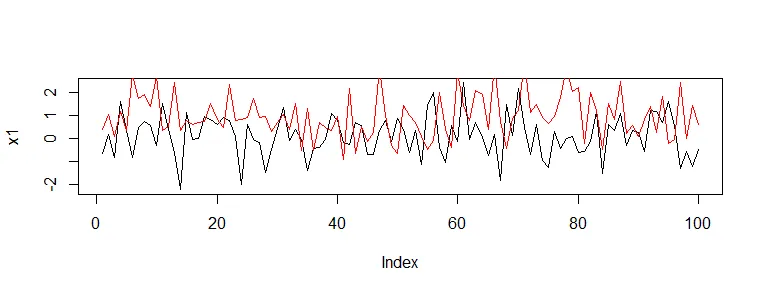
plot(x1,type='l')
lines(x2,type='l',col='red')
points(x.points,y.points,col='blue')
# Segment overlap
start.segment <- joint.points[-1][diff(joint.points) == 1] - 1
for (i in start.segment) lines(x = c(i, i+1), y = x1[c(i, i+1)], col = 'blue')
above <- x1 > x2 而不是 above <- x1 >= x2,因为已经具有相同值的点也会相交? - ExploreRabove <- x1 >= x2并不能修复它,你必须显式地处理这些情况。 - nograpes这里有一份备选的线段相交代码,
# segment-segment intersection code
# http://paulbourke.net/geometry/pointlineplane/
ssi <- function(x1, x2, x3, x4, y1, y2, y3, y4){
denom <- ((y4 - y3)*(x2 - x1) - (x4 - x3)*(y2 - y1))
denom[abs(denom) < 1e-10] <- NA # parallel lines
ua <- ((x4 - x3)*(y1 - y3) - (y4 - y3)*(x1 - x3)) / denom
ub <- ((x2 - x1)*(y1 - y3) - (y2 - y1)*(x1 - x3)) / denom
x <- x1 + ua * (x2 - x1)
y <- y1 + ua * (y2 - y1)
inside <- (ua >= 0) & (ua <= 1) & (ub >= 0) & (ub <= 1)
data.frame(x = ifelse(inside, x, NA),
y = ifelse(inside, y, NA))
}
# do it with two polylines (xy dataframes)
ssi_polyline <- function(l1, l2){
n1 <- nrow(l1)
n2 <- nrow(l2)
stopifnot(n1==n2)
x1 <- l1[-n1,1] ; y1 <- l1[-n1,2]
x2 <- l1[-1L,1] ; y2 <- l1[-1L,2]
x3 <- l2[-n2,1] ; y3 <- l2[-n2,2]
x4 <- l2[-1L,1] ; y4 <- l2[-1L,2]
ssi(x1, x2, x3, x4, y1, y2, y3, y4)
}
# do it with all columns of a matrix
ssi_matrix <- function(x, m){
# pairwise combinations
cn <- combn(ncol(m), 2)
test_pair <- function(i){
l1 <- cbind(x, m[,cn[1,i]])
l2 <- cbind(x, m[,cn[2,i]])
pts <- ssi_polyline(l1, l2)
pts[complete.cases(pts),]
}
ints <- lapply(seq_len(ncol(cn)), test_pair)
do.call(rbind, ints)
}
# testing the above
y1 = rnorm(100,0,1)
y2 = rnorm(100,1,1)
m = cbind(y1, y2)
x = 1:100
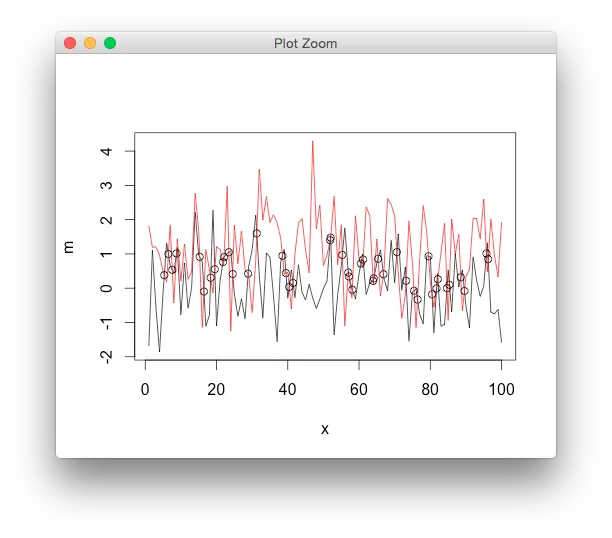
matplot(x, m, t="l", lty=1)
points(ssi_matrix(x, m))
inside <- ua > 0 $$ ua < 1 && ...。 - Carl Witthoft虽然回复有些晚,但是这里提供了一种使用SP和RGEOS包的“空间”方法。这需要x和y都是数值型的(或可以转换为数值型)。投影是任意的,但epsg:4269似乎很有效:
library(sp)
library(rgeos)
# dummy x data
x1 = rnorm(100,0,1)
x2 = rnorm(100,1,1)

#dummy y data
y1 <- seq(1, 100, 1)
y2 <- seq(1, 100, 1)

# convert to a sp object (spatial lines)
l1 <- Line(matrix(c(x1, y1), nc = 2, byrow = F))
l2 <- Line(matrix(c(x2, y2), nc = 2, byrow = F))
ll1 <- Lines(list(l1), ID = "1")
ll2 <- Lines(list(l2), ID = "1")
sl1 <- SpatialLines(list(ll1), proj4string = CRS("+init=epsg:4269"))
sl2 <- SpatialLines(list(ll2), proj4string = CRS("+init=epsg:4269"))

# Calculate locations where spatial lines intersect
int.pts <- gIntersection(sl1, sl2, byid = TRUE)
int.coords <- int.pts@coords

# Plot line data and points of intersection
plot(x1, y1, type = "l")
lines(x2, y2, type = "l", col = "red")
points(int.coords[,1], int.coords[,2], pch = 20, col = "blue")
我需要另一个应用程序的交集,并发现nograpes的答案不正确:
# another example
x=seq(-4,6,length.out=10)
x1=dnorm(x, 0, 1)
x2=dnorm(x,2,2)

# Find points where x1 is above x2.
above <- x1 > x2

# Points always intersect when above=TRUE, then FALSE or reverse
intersect.points <- which(diff(above) != 0)

# Find the slopes for each line segment.
x1.slopes <- x1[intersect.points+1] - x1[intersect.points]
x2.slopes <- x2[intersect.points+1] - x2[intersect.points]

# Find the intersection for each segment.
x.points <- x[intersect.points] + ((x2[intersect.points] - x1[intersect.points]) / (x1.slopes-x2.slopes))
y.points <- x1[intersect.points] + (x1.slopes*(x.points-x[intersect.points]))

# Joint points
joint.points <- which(x1 == x2)
x.points <- c(x.points, joint.points)
y.points <- c(y.points, x1[joint.points])

# Plot points
# length(x); length(x1)
plot(x, x1,type='l')
lines(x, x2,type='l',col='red')
points(x.points,y.points,col='blue')
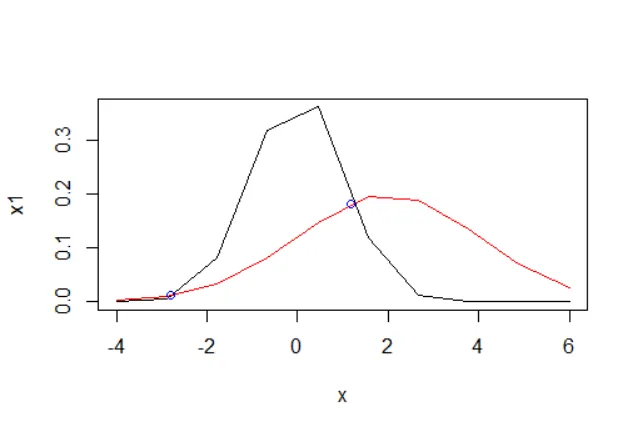
intersect.points替换为x[intersect.points],但这还不够。这很遗憾,因为与其他方法相比,该方法相对简单。由baptiste提供的方法效果要好得多:m = cbind(x1, x2)
matplot(x, m, t="l", lty=1)
points(ssi_matrix(x, m))
按照同样的思路,更一般的实现方式允许相邻 x 值之间的差异 != 1:
intersect.2lines <- function (x, y1, y2){
  above = y1 > y2
  intersect.points <- which(diff(above) != 0)

  y1.diff <- y1[intersect.points+1] - y1[intersect.points]
  y2.diff <- y2[intersect.points+1] - y2[intersect.points]
  x.diff <- x[intersect.points+1]-x[intersect.points]

  slope1 = y1.diff/x.diff
  slope2 = y2.diff/x.diff
  intercept1 = y1[intersect.points]-slope1*x[intersect.points]
  intercept2 = y2[intersect.points]-slope2*x[intersect.points]
  x.points = ifelse(slope1==slope2, NA,
                  (intercept2-intercept1)/(slope1-slope2))
  y.points = ifelse(slope1==slope2, NA,
                  slope1*x.points+intercept1)
  # Joint points
  joint.points <- which(y1 == y2)
  x.points <- c(x.points, x[joint.points])
  y.points <- c(y.points, y1[joint.points])
  return(data.frame(x.points=x.points, y.points=y.points))
}
这是维基百科上给出的公式实现,“给定两条直线方程” 直线交点
现在的结果与baptiste方法产生的结果完全相同。
plot(x1,x2, type='l')中找到所有的线交叉点吗? - Stephen Hendersonplot(seq_along(x1), x1, type='l')和lines(seq_along(x2), x2, type='l', col="red")的交叉点吗? - Stephen Henderson