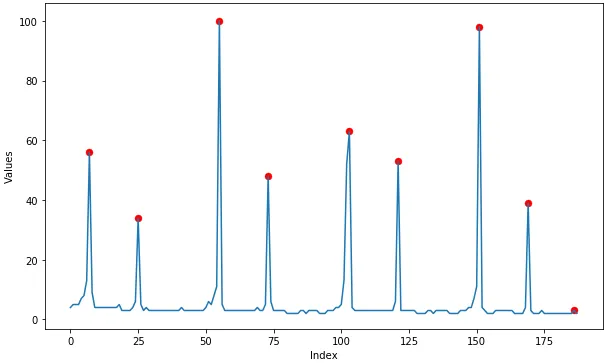
我希望检测包含趋势和季节性成分的“时间序列数据”中的异常值。我想忽略季节性峰值,只考虑其他峰值并将它们标记为异常值。由于我对时间序列分析不熟悉,请协助我解决这个时间序列问题。
使用的编程平台是Python。
尝试1:使用ARIMA模型
我已经训练了我的模型并对测试数据进行了预测。然后,能够计算预测结果与测试数据的实际值之间的差异,根据观察到的方差找出异常值。
应用自动Arima模型
!pip install pyramid-arima
from pyramid.arima import auto_arima
stepwise_model = auto_arima(train_log, start_p=1, start_q=1,max_p=3, max_q=3,m=7,start_P=0, seasonal=True,d=1, D=1, trace=True,error_action='ignore', suppress_warnings=True,stepwise=True)
import math
import statsmodels.api as sm
import statsmodels.tsa.api as smt
from sklearn.metrics import mean_squared_error
将数据分为训练集和测试集
train, test = actual_vals[0:-70], actual_vals[-70:]
对数变换
train_log, test_log = np.log10(train), np.log10(test)
转换为列表
history = [x for x in train_log]
predictions = list()
predict_log=list()
拟合逐步ARIMA模型
for t in range(len(test_log)):
stepwise_model.fit(history)
    output = stepwise_model.predict(n_periods=1)
    predict_log.append(output[0])
    yhat = 10**output[0]
    predictions.append(yhat)
    obs = test_log[t]
    history.append(obs)
绘图
figsize=(12, 7)
plt.figure(figsize=figsize)
pyplot.plot(test,label='Actuals')
pyplot.plot(predictions, color='red',label='Predicted')
pyplot.legend(loc='upper right')
pyplot.show()
但是我只能在测试数据中检测到异常值。实际上,我需要检测整个时间序列数据,包括我已经拥有的训练数据中的异常值。
尝试2:使用季节性分解
我已经使用下面的代码将原始数据分解为季节性、趋势和残差,并可以在下面的图像中看到。
from statsmodels.tsa.seasonal import seasonal_decompose

decomposed = seasonal_decompose()
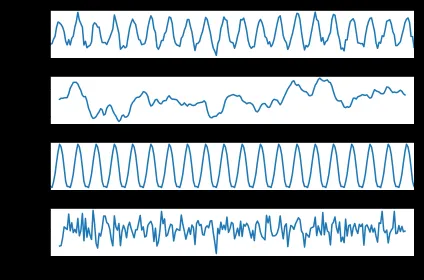
我现在正在使用剩余数据通过箱线图查找异常值,因为已经删除了季节性和趋势分量。这样做有意义吗?
或者说还有其他更简单或更好的方法可以使用吗?